Mapped: Europe’s GDP Per Capita, by Country
The Growth of a $1,000 Equity Investment, by Stock Market
Mapped: The Most Valuable Company in Each Southeast Asian Country
Visualizing Global Inflation Forecasts (2024-2026)
The World’s Fastest Growing Emerging Markets (2024-2029 Forecast)
Countries With the Highest Rates of Crypto Ownership
Mapped: The Number of AI Startups By Country
All of the Grants Given by the U.S. CHIPS Act
Visualizing AI Patents by Country
How Tech Logos Have Evolved Over Time
Visualizing the Tax Burden of Every U.S. State
Charted: What Frustrates Americans About the Tax System
Ranked: The Top 20 Countries in Debt to China
Charted: Which Country Has the Most Billionaires in 2024?
Charted: Which City Has the Most Billionaires in 2024?
Mapped: Countries Where Recreational Cannabis is Legal
Which Countries Have the Highest Infant Mortality Rates?
Life Expectancy by Region (1950-2050F)
What Causes Preventable Child Deaths?
The Cost of an EpiPen in Major Markets
Who’s Building the Most Solar Energy?
Mapped: The Age of Energy Projects in Interconnection Queues, by State
Ranked: The Top 10 EV Battery Manufacturers in 2023
The World’s Biggest Nuclear Energy Producers
The World’s Biggest Oil Producers in 2023
Mapped: U.S. Immigrants by Region
Mapped: Southeast Asia’s GDP Per Capita, by Country
The Largest Earthquakes in the New York Area (1970-2024)
Mapped: Average Wages Across Europe
Visualizing Copper Production by Country in 2023
Where the World’s Aluminum is Smelted, by Country
Visualizing Global Gold Production in 2023
Gold vs. S&P 500: Which Has Grown More Over Five Years?
How People Get Around in America, Europe, and Asia
The Carbon Footprint of Major Travel Methods
Ranking the Top 15 Countries by Carbon Tax Revenue
Ranked: The Countries With the Most Air Pollution in 2023
Top Countries By Forest Growth Since 2001
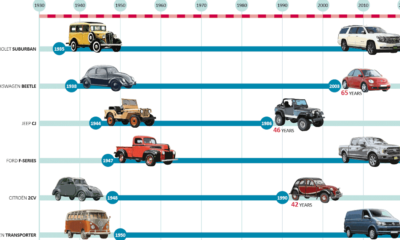
Successful cars come in many shapes and sizes. See which ones have stood the test of time in this infographic.
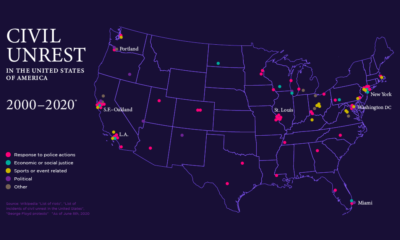
This map of civil unrest in the United States helps provide much needed context on how individual events fit within the nation-wide pattern over time.
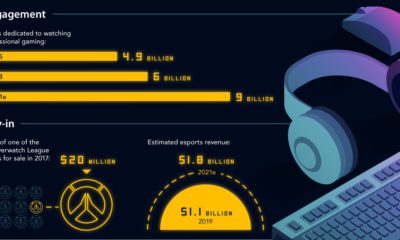
This infographic plots the journey of esports, from underground niche to a billion-dollar mainstream phenomenon—and it shows no signs of slowing down.
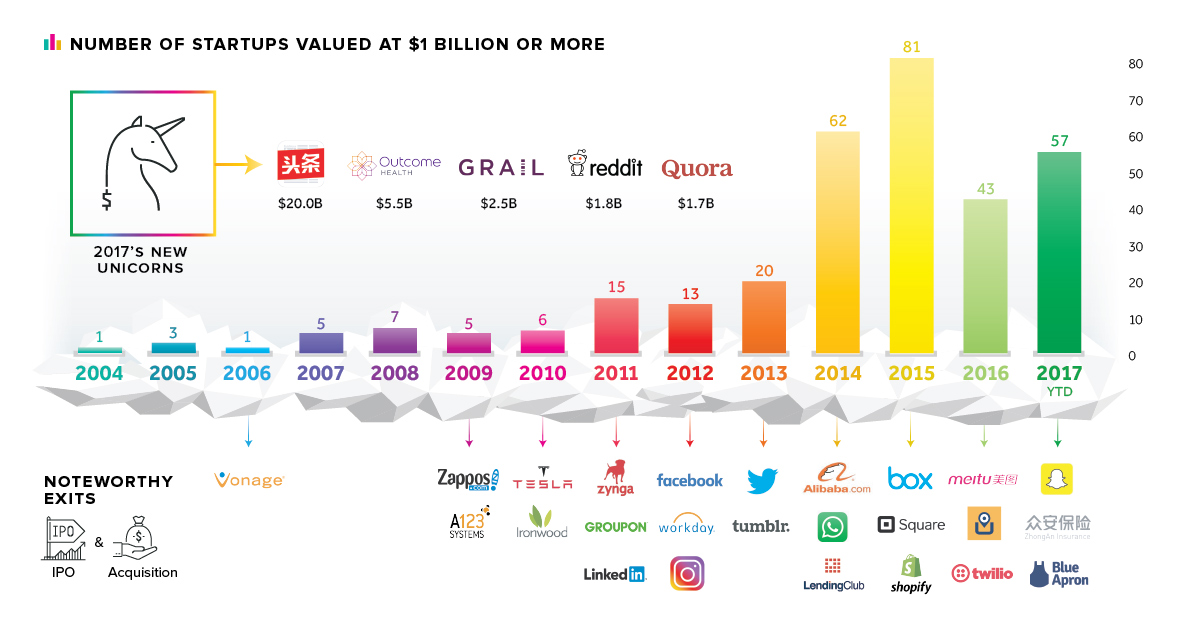
Total new unicorns in 2017 is down from its frothy peak - but this year brings several interesting new entrants, like China's Toutiao, valued at a...
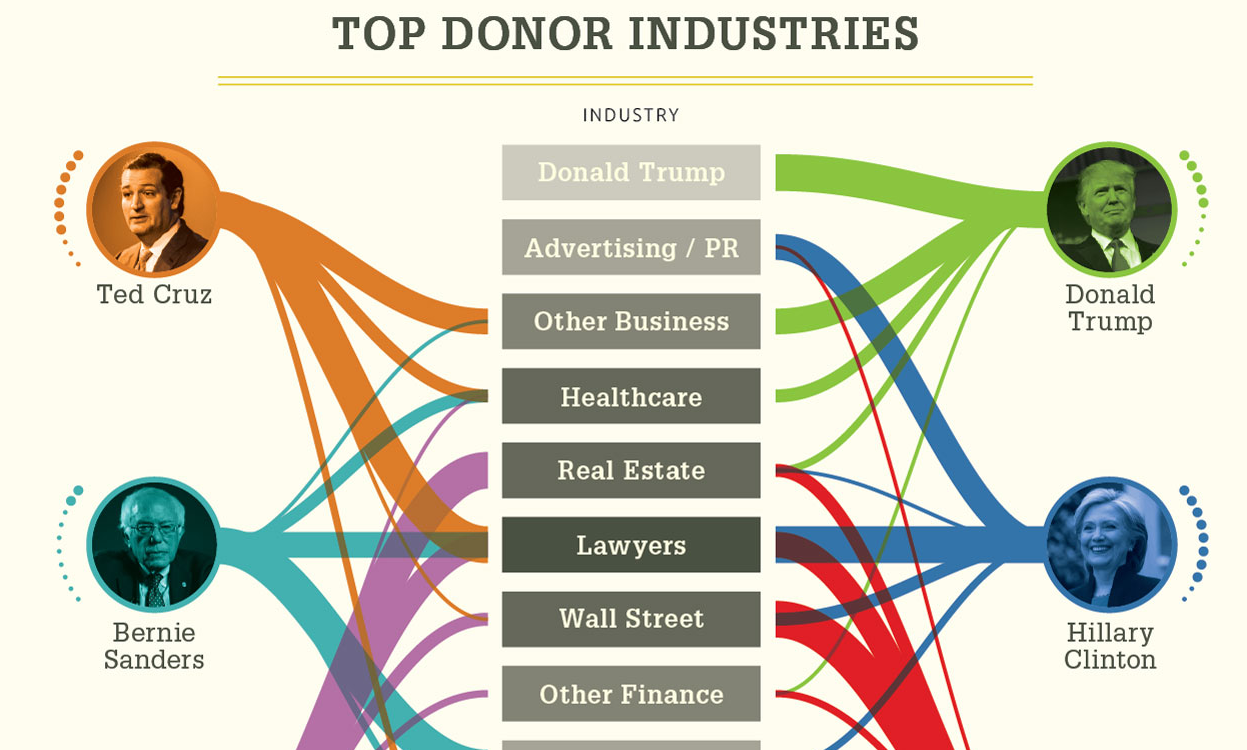
What if politicians displayed their donors on their uniforms like NASCAR drivers?
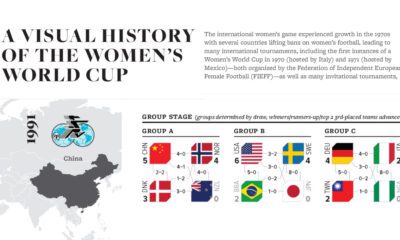
From only 12 teams to 32 teams and record-breaking attendance in 2023: This graphic charts the Women's World Cup's growth since 1991.
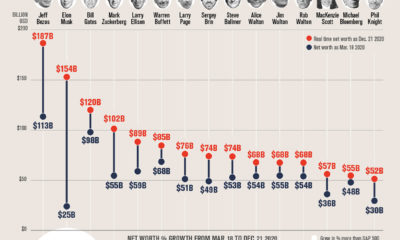
The net worth of some American Billionaires has grown substantially since the COVID-19 market bottom. Here's how much their fortunes grew.
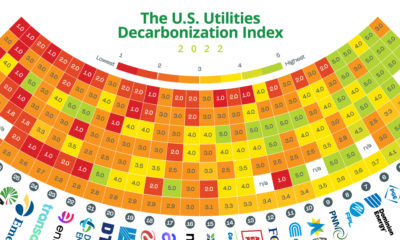
This graphic quantifies and compares the state of decarbonization among the 30 largest investor-owned utilities in the United States.
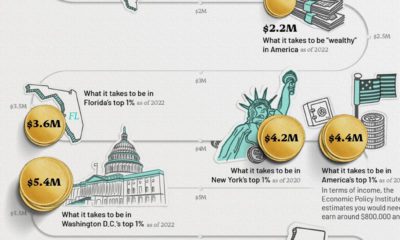
This infographic visualizes several net worth milestones to give you a better idea of where you stand today.
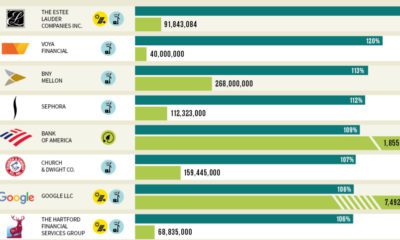
Which U.S. companies use the most green energy as a percentage of total energy used? Here are the 50 highest ranked companies according to the EPA.


 Creator Program