Misc
Explore this Fascinating Map of Medieval Europe
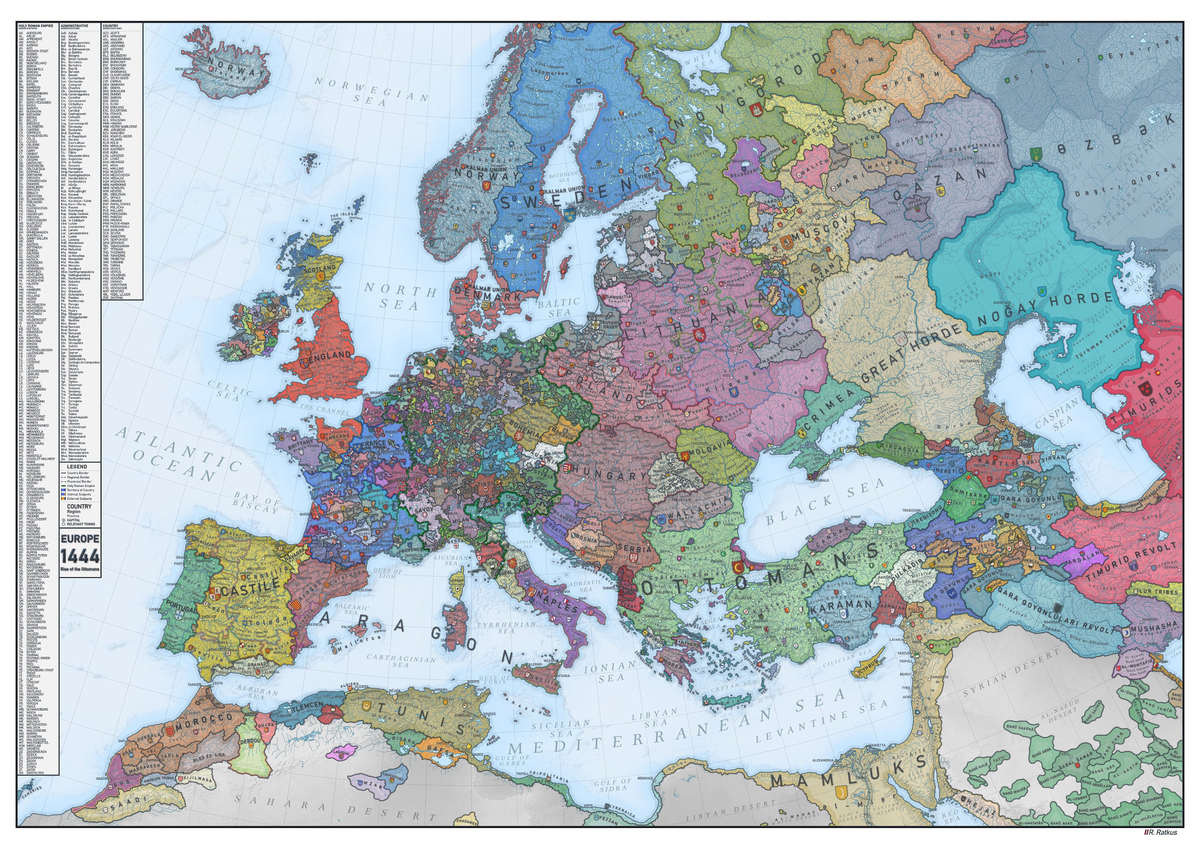
View the full-size (13 MB) version of this map.
Explore this Fascinating Map of Medieval Europe
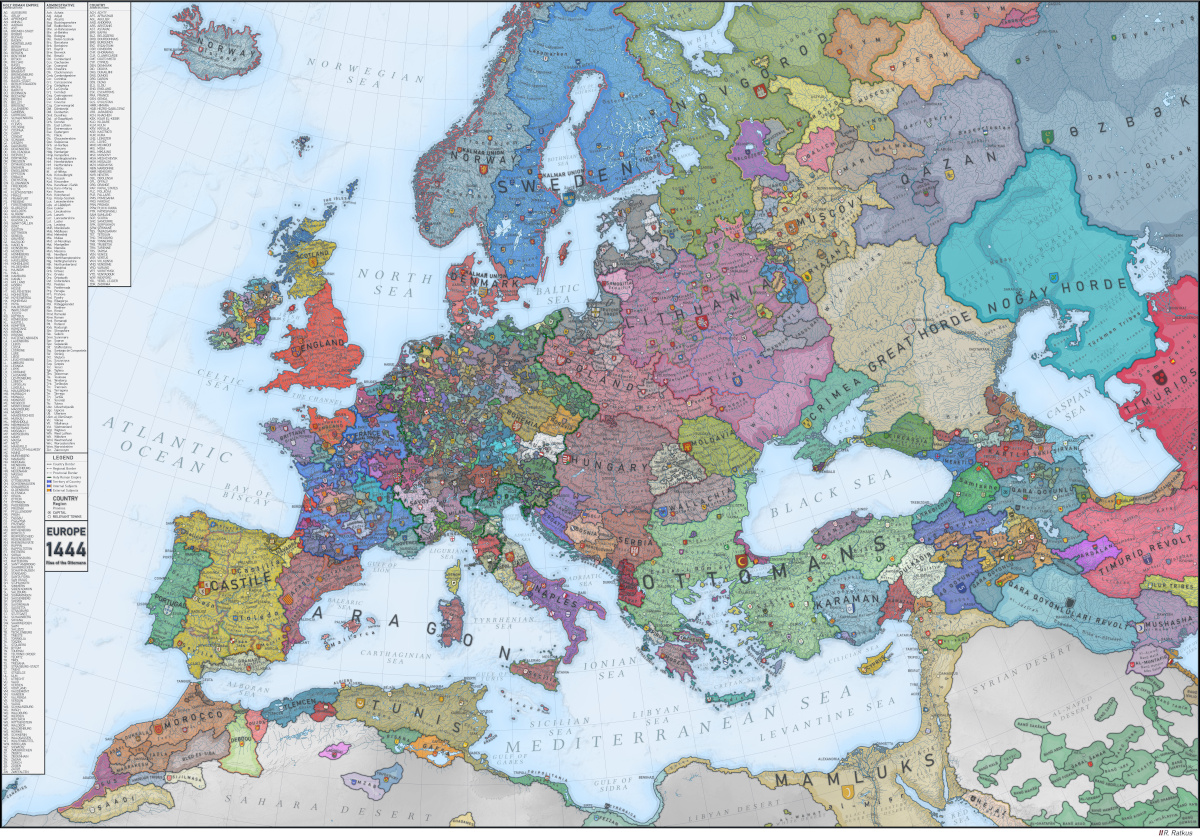
What did Europe look like in the Middle Ages? That’s a tough question to answer since Europe’s borders and territories were (and still are) constantly in flux.
This map, shared by Reddit user /ratkatavobratka, provides a historical snapshot of Europe in 1444—a time when European society was made up mostly of independent territories that were governed by landowners rather than a centralized authority.
Below, we’ll take a closer look at some key regions on the map, and what was happening in these areas at the time.
Some Context: Why 1444?
Before we dive into the analysis, first thing’s first—what’s so special about the year 1444?
It was the year of the Battle of Varna. That’s when the Ottoman army defeated the Hungarians and allowed the Ottoman Empire to expand its reign.
It’s considered a pivotal moment for Ottoman expansion into Southern Europe. In fact, this battle is so historically significant, it was chosen as the start date for a popular video game called Europa Universalis IV.
Feudalism in Medieval Europe
One of the most immediately obvious details of this map of medieval Europe is how fragmented Western Europe was at the time.
This vast array of independent territories technically made up the Holy Roman Empire (the empire’s borders are highlighted in green on the map). But why was the Holy Roman Empire so fragmented?
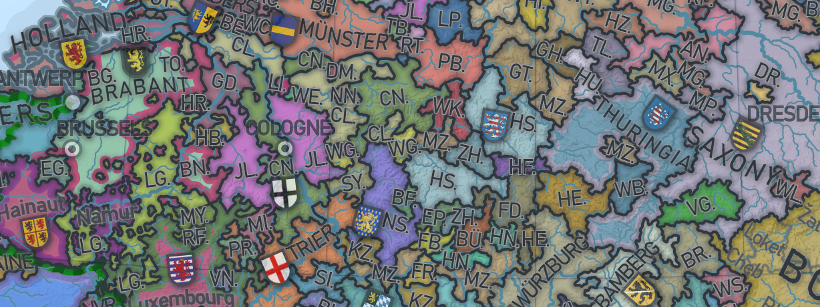
The empire was subdivided into individually governed entities at the time. These independent territories were governed by nobility rather than an absolute monarch. This was possible because the empire was run by the feudal system.
For the non-history buffs reading this, the feudal system was a socio-political system largely characterized by its lack of public authority. Theoretically, it was meant to have a distinct hierarchy:
- Monarchs
At the top of the feudal food chain, monarchs were meant to hold absolute power over their land. However, many lords held so much power over their manors that the monarch acted more as a figurehead. - Lords and Ladies (Nobility)
The nobility was supposed to act as middle management— they were in charge of managing the land and the peasants who worked on it. - Knights
Protectors of the land, knights followed a strict code of conduct, known as chivalry. If they failed to follow their chivalry, their title and land was taken from them. - Peasants
A majority of the medieval population was made up of peasants, who did all the work on the land so lords and knights could plan and prepare for war.
Between the 1200-1400s, battles between nobles and monarchs were almost constant, and the map shows a time when estates were largely governed by the nobility. However, it’s important to note that in the years following 1444, monarchs gradually began to regain their power.
Eventually, governing became more consolidated, and this gradual transition to absolute monarchy marked the early stages of what we now recognize as nation states.
Mighty Lithuania
One very prominent and perhaps surprising section of the map is the Grand Duchy of Lithuania, which today would include large portions of Poland, Belarus, and Ukraine. This snapshot depicts Lithuania at the height of its power, when their territory stretched all the way from the Baltic Sea down to the Black Sea, near Crimea.
Over time power ebbs and flows, and today Lithuania is a much more compact nation.
Staying Power
Europe’s borders have shifted constantly over the long history of the continent, but one area has remained remarkably consistent. On the map above, Portugal looks nearly identical to its present day form. This is because the country’s border with Spain–one of the world’s oldest–has barely shifted at all since the 13th century.
Zooming in on the South: The Rise of the Ottoman Empire
While the Holy Roman Empire was highly fragmented, other empires were much more unified.
For instance, the Ottoman Empire had a much more centralized governing system. In 1444, it was ruled by Fatih Sultan Mehmed (which is Turkish for Sultan Mehmed, the Conqueror). During his reign, the Ottoman Empire conquered Constantinople (now known as Istanbul), which had been ruled by the Byzantine Empire for over a thousand years before the Ottoman army seized power.
Because the Byzantine Empire was what was left of the Roman Empire, this takeover also marked the final fall of the Roman Empire.
Maps Freeze Time
Historical maps are fascinating because they provide a snapshot of the world as it once was (but no longer is).
As previously mentioned, Europe’s borders were (and still are) constantly changing. And it’s interesting to look back on previous eras to remember how far we’ve come.


Misc
The Top 25 Nationalities of U.S. Immigrants
Mexico is the largest source of immigrants to the U.S., with almost 11 million immigrants.


The Top 25 Nationalities of U.S. Immigrants
This was originally posted on our Voronoi app. Download the app for free on iOS or Android and discover incredible data-driven charts from a variety of trusted sources.
The United States is home to more than 46 million immigrants, constituting approximately 14% of its total population.
This graphic displays the top 25 countries of origin for U.S. immigrants, based on 2022 estimates. The data is sourced from the Migration Policy Institute (MPI), which analyzed information from the U.S. Census Bureau’s 2022 American Community Survey.
In this context, “immigrants” refer to individuals residing in the United States who were not U.S. citizens at birth.
Mexico Emerges as a Leading Source of Immigration
Mexico stands out as the largest contributor to U.S. immigration due to its geographical proximity and historical ties.
Various economic factors, including wage disparities and employment opportunities, motivate many Mexicans to seek better prospects north of the border.
| Country | Region | # of Immigrants |
|---|---|---|
| 🇲🇽 Mexico | Latin America & Caribbean | 10,678,502 |
| 🇮🇳 India | Asia | 2,839,618 |
| 🇨🇳 China | Asia | 2,217,894 |
| 🇵🇭 Philippines | Asia | 1,982,333 |
| 🇸🇻 El Salvador | Latin America & Caribbean | 1,407,622 |
| 🇻🇳 Vietnam | Asia | 1,331,192 |
| 🇨🇺 Cuba | Latin America & Caribbean | 1,312,510 |
| 🇩🇴 Dominican Republic | Latin America & Caribbean | 1,279,900 |
| 🇬🇹 Guatemala | Latin America & Caribbean | 1,148,543 |
| 🇰🇷 Korea | Asia | 1,045,100 |
| 🇨🇴 Colombia | Latin America & Caribbean | 928,053 |
| 🇭🇳 Honduras | Latin America & Caribbean | 843,774 |
| 🇨🇦 Canada | Northern America | 821,322 |
| 🇯🇲 Jamaica | Latin America & Caribbean | 804,775 |
| 🇭🇹 Haiti | Latin America & Caribbean | 730,780 |
| 🇬🇧 United Kingdom | Europe | 676,652 |
| 🇻🇪 Venezuela | Latin America & Caribbean | 667,664 |
| 🇧🇷 Brazil | Latin America & Caribbean | 618,525 |
| 🇩🇪 Germany | Europe | 537,484 |
| 🇪🇨 Ecuador | Latin America & Caribbean | 518,287 |
| 🇵🇪 Peru | Latin America & Caribbean | 471,988 |
| 🇳🇬 Nigeria | Africa | 448,405 |
| 🇺🇦 Ukraine | Europe | 427,163 |
| 🇮🇷 Iran | Middle East | 407,283 |
| 🇵🇰 Pakistan | Asia | 399,086 |
| Rest of World | 11,637,634 | |
| Total | 46,182,089 |
Mexicans are followed in this ranking by Indians, Chinese, and Filipinos, though most immigrants on this list come from countries in the Latin American and Caribbean region.
On the other hand, only three European countries are among the top sources of U.S. immigrants: the UK, Germany, and Ukraine.
Immigration continues to be a significant factor contributing to the overall growth of the U.S. population. Overall population growth has decelerated over the past decade primarily due to declining birth rates.
Between 2021 and 2022, the increase in the immigrant population accounted for 65% of the total population growth in the U.S., representing 912,000 individuals out of nearly 1.4 million.
If you enjoyed this post, be sure to check out Visualized: Why Do People Immigrate to the U.S.? This visualization shows the different reasons cited by new arrivals to America in 2021.

-

 Personal Finance1 week ago
Visualizing the Tax Burden of Every U.S. State
-

 Misc6 days ago
Visualized: Aircraft Carriers by Country
-

 Culture6 days ago
How Popular Snack Brand Logos Have Changed
-

 Mining1 week ago
Visualizing Copper Production by Country in 2023
-

 Misc1 week ago
Charted: How Americans Feel About Federal Government Agencies
-

 Healthcare1 week ago
Which Countries Have the Highest Infant Mortality Rates?
-

 Demographics1 week ago
Mapped: U.S. Immigrants by Region
-

 Maps1 week ago
Mapped: Southeast Asia’s GDP Per Capita, by Country