Misc
Mapped: Top Countries by Tourist Spending
Mapped: Top Countries by Tourist Spending
Many people spend their days looking forward to their next getaway. But do you know exactly how much these vacation plans contribute economically to your chosen destination?
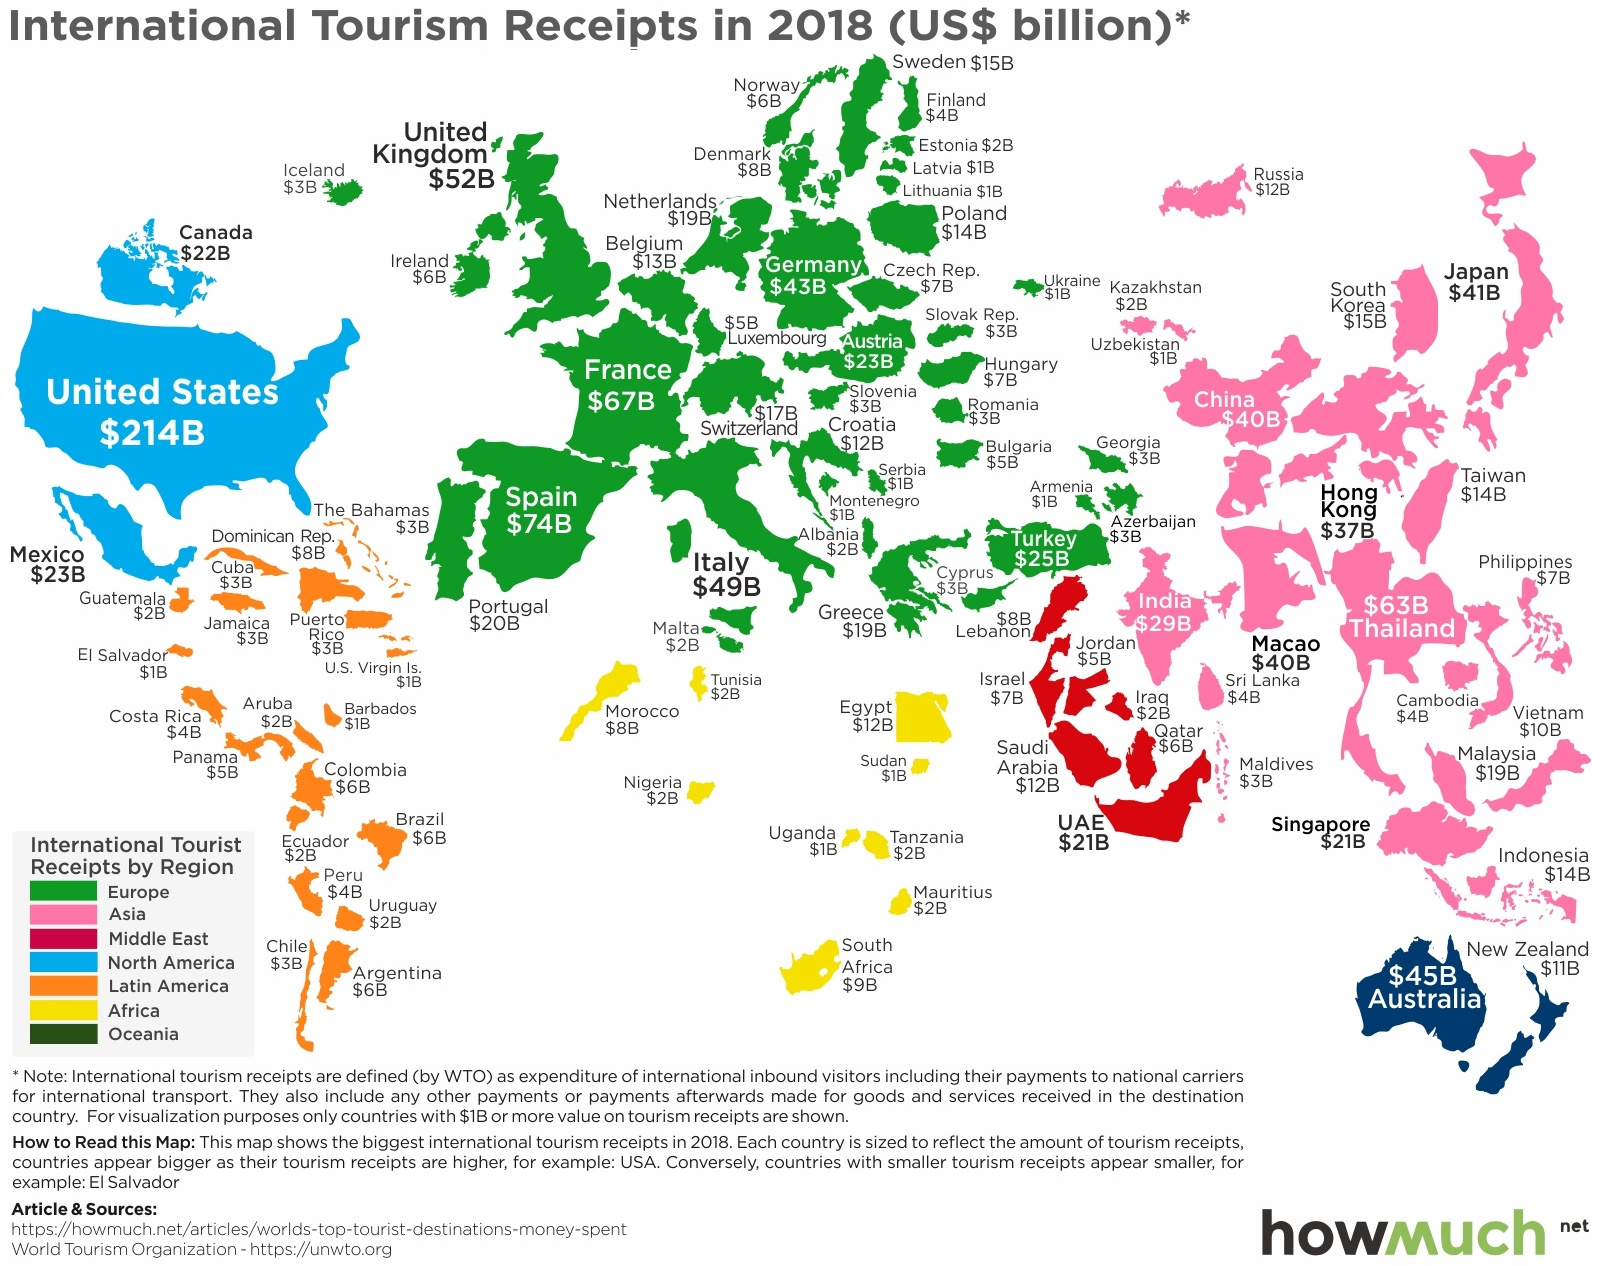
Today’s visualization from HowMuch.net highlights the countries in which tourists spend the most money. Locations have been resized based on spending amounts, which come from the latest data from the World Tourism Organization (UNWTO).
Oh, The Places Tourists Will Go
Across the different regions, Europe’s combined tourist spending dominates at $570 billion. Easy access to closely-located countries, both via rail networks and a shared currency, may be a reason why almost 710 million visitors toured the region in 2018.
Asia-Pacific, which includes Australia and numerous smaller islands, saw the greatest growth in tourism expenditures. Total spending reached $435 billion in 2018—a 7% year-over-year increase, from 348 million visitors. Not surprisingly, some areas such as Macao (SAR) tend to rely heavily on tourists as a primary economic driver.
Here’s how other continental regions fared, in terms of tourist spending and visitors:
- Americas
Total expenditures: $333 billion
Total visitors: 216 million
Expenses per visitor: $1,542 - Middle East
Total expenditures: $73 billion
Total visitors: 60 million
Expenses per visitor: $1,216 - Africa
Total expenditures: $38 billion
Total visitors: 67 million
Expenses per visitor: $567
Of course, these numbers only paint a rudimentary picture of global tourism, as they vary greatly even within these regions. Let’s look closer at the individual country data for 2018, compared to previous years.
The Top Tourist Hotspots, By Country
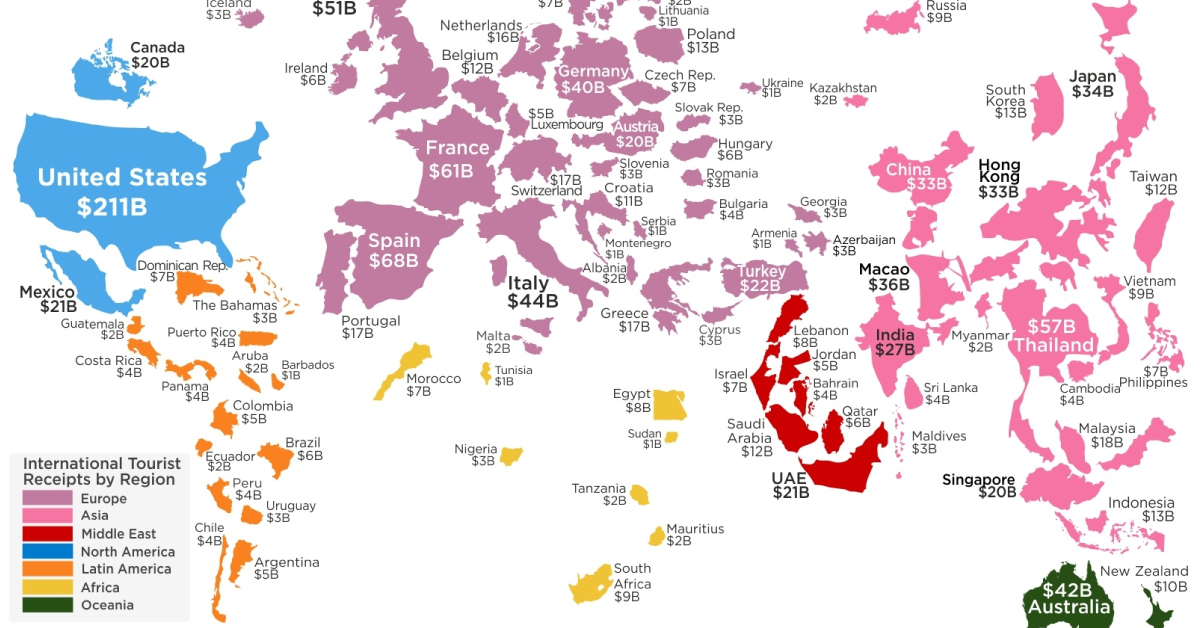
It seems that many tourists are gravitating towards the same destinations, as evidenced by both the number of arrivals and overall expenditures for 2017 and 2018 alike.
| Country | 2018 Spending | 2018 Arrivals | Country | 2017 Spending | 2017 Arrivals | |
|---|---|---|---|---|---|---|
| 1. U.S. 🇺🇸 | $214.5B | 79.6M | 1. U.S. 🇺🇸 | $210.7B | 74.8M | |
| 2. Spain 🇪🇸 | $73.8B | 82.8M | 2. Spain 🇪🇸 | $68B | 81.8M | |
| 2. France 🇫🇷 | $67.4B | 89.4M | 3. France 🇫🇷 | $60.7B | 86.9M | |
| 4. Thailand 🇹🇭 | $63B | 38.3M | 4. Thailand 🇹🇭 | $57.5B | 35.4M | |
| 5. UK 🇬🇧 | $51.9B | 36.3M | 5. UK 🇬🇧 | 51.2B | 37.7M | |
| 6. Italy 🇮🇹 | $49.3B | 62.1M | 6. Italy 🇮🇹 | $44.2B | 58.3M | |
| 7. Australia 🇦🇺 | $45B | 9.2M | 7. Australia 🇦🇺 | $41.7B | 8.8M | |
| 8. Germany 🇩🇪 | $43B | 38.9M | 8. Germany 🇩🇪 | $39.8B | 37.5M | |
| 9. Japan 🇯🇵 | $41.1B | 31.2M | 9. Macao (SAR) 🇲🇴 | $35.6B | 17M | |
| 10. China 🇨🇳 | $40.4B | 62.9M | 10. Japan 🇯🇵 | $34.1B | 28.6M |
Source: World Tourism Organization (UNWTO).
Note that data is for international tourism only and does not include domestic tourism.
The top contenders have remained fairly consistent, as each country brings something unique to the table—from natural wonders to historic and man-made structures.
Where Highest-Spending Tourists Come From
The nationality of tourists also seems to be a factor in these total expenditures. Chinese tourists spent $277 billion internationally in 2018, likely thanks to the increasing consumption of an emerging, affluent middle class.
Interestingly, this amount is almost twice the combined $144 billion that American tourists spent overseas in the same year.


Public Opinion
Charted: How Democrats and Republicans View Government Agencies
Predictably, results diverge when both Democrats and Republicans are asked to rate key government agencies in the United States.

How Democrats and Republicans View Government Agencies
This was originally posted on our Voronoi app. Download the app for free on iOS or Android and discover incredible data-driven charts from a variety of trusted sources.
Forget the presidential race, the partisan divide in America can also be seen by how Democrats and Republicans feel about key government agencies.
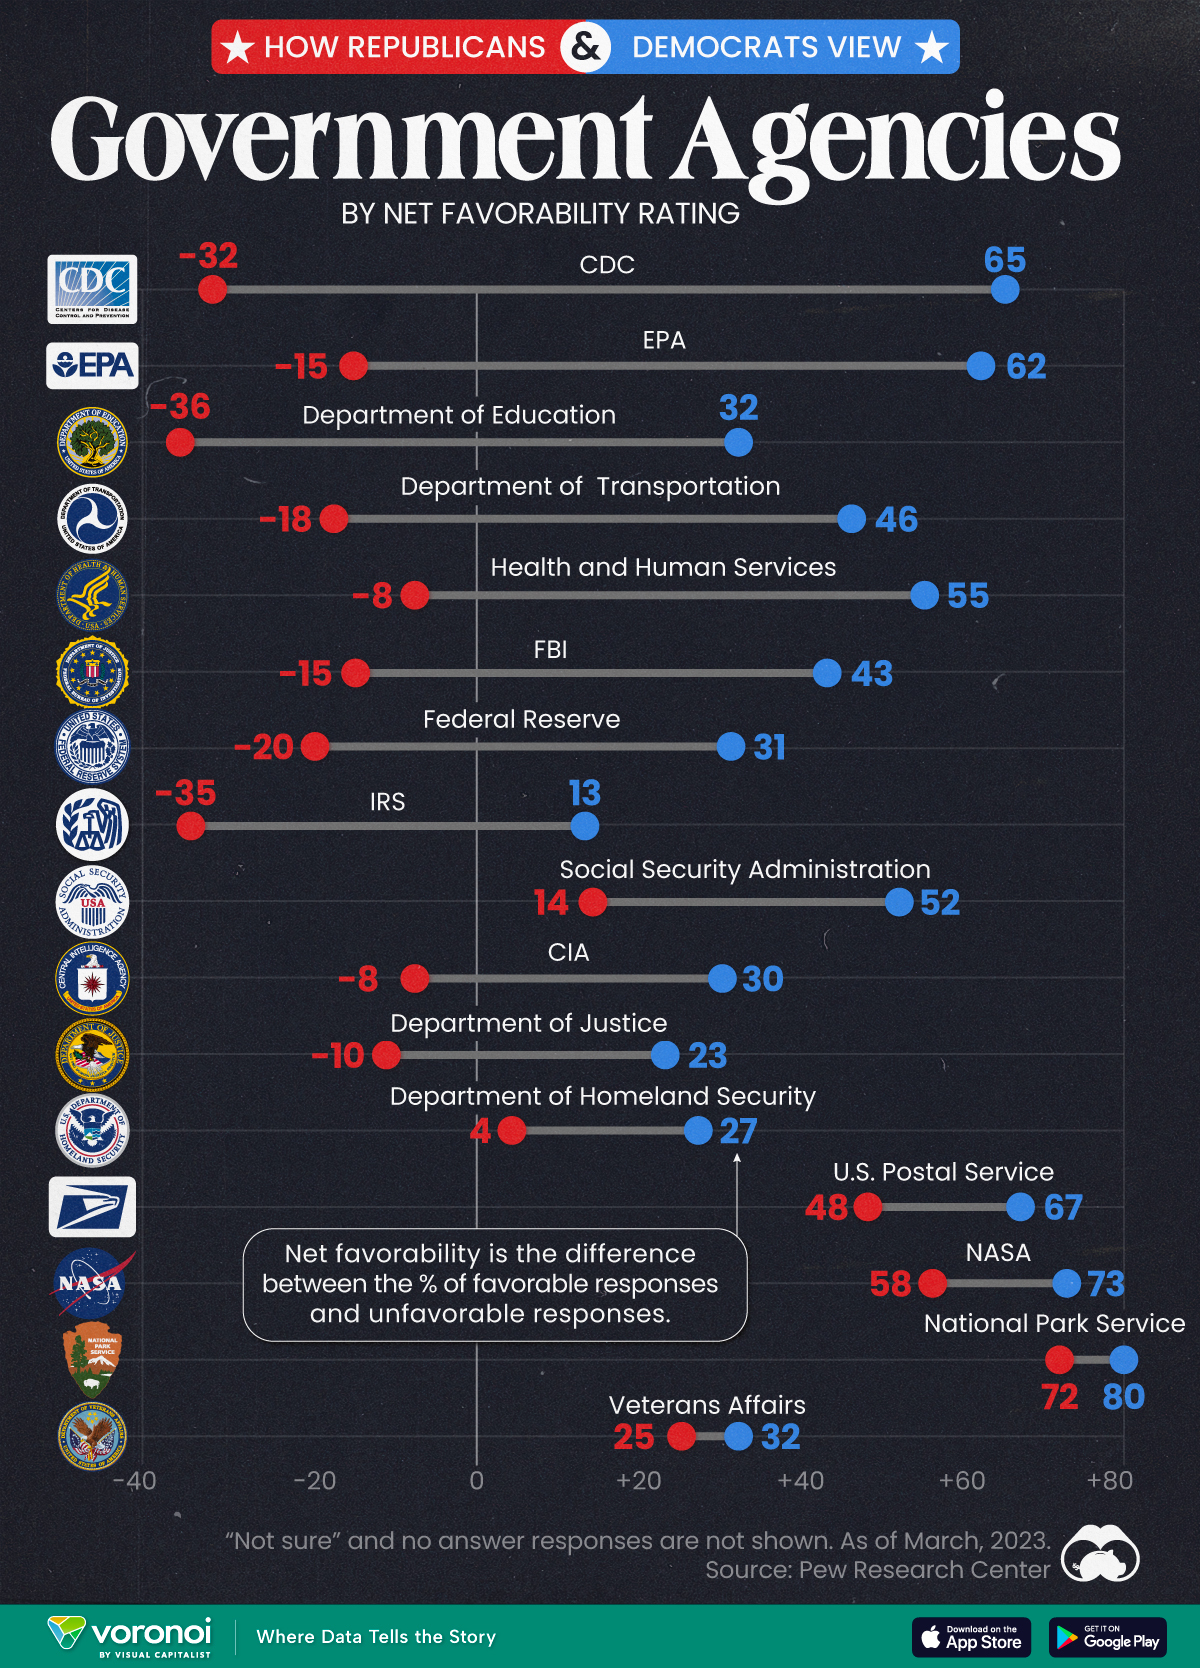
We visualize the net favorability ratings of 16 federal government agencies, based on respondent party affiliation.
To find this data, Pew Research Center surveyed more than 10,000 adults, between March 13-19, 2023. View their methodology page for more details about the survey, the questions asked, and the results obtained.
Republicans Don’t Like How the CDC Handled the Pandemic
The division in net favorability is deepest for three federal government agencies. While the CDC garnered a net favorability rating of 65 from Democrats, more Republicans rated the agency unfavorably, leading to a net favorability rating of -32.
Similarly, with the EPA and the Department of Education, the difference in net favorability between the two voting sides is as high as 70–80 points.
| Federal Agency | Republican Net Favorability Rating | Democrat Net Favorability Rating |
|---|---|---|
| 🔬 CDC | -32 | 65 |
| 🌿 EPA | -15 | 62 |
| 📚 Department of Education | -36 | 32 |
| 🚗 Department of Transportation | -18 | 46 |
| 💉 Health and Humans Services | -8 | 55 |
| 💰 Federal Reserve | -20 | 31 |
| 🕵️ FBI | -15 | 43 |
| 💼 IRS | -35 | 13 |
| 💼 Social Security Admin | 14 | 52 |
| 🕵️♂️ CIA | -8 | 30 |
| ⚖️ Justice Department | -10 | 23 |
| 🛡️ Homeland Security | 4 | 27 |
| 📮 USPS | 48 | 67 |
| 🚀 NASA | 58 | 73 |
| 🏞️ Park Service | 72 | 80 |
| 🎖️ Veterans Affairs | 25 | 32 |
Pew Research Center notes that Republicans didn’t always view the CDC quite so unfavorably, though a direct comparison is impossible.
Nevertheless, per the source, in March 2020, 84% of surveyed Republicans expressed positive views of the CDC’s performance. By October 2022, just 32% said the CDC had done an excellent or good job of handling the pandemic.
Meanwhile, there are a few agencies the two sides do agree on: the National Park Service, the Postal Service, and NASA.
And they both agree on Veterans Affairs as well: though neither share a particularly high opinion of the organization.
Finally, Democrats consistently rate all sixteen agencies on the survey more favorably than Republicans, showing consistency about how each side views the government in general.

-

 Maps7 days ago
Mapped: Southeast Asia’s GDP Per Capita, by Country
-

 Markets2 weeks ago
Visualizing Global Inflation Forecasts (2024-2026)
-

 United States2 weeks ago
Charted: What Southeast Asia Thinks About China & the U.S.
-

 United States2 weeks ago
The Evolution of U.S. Beer Logos
-

 Healthcare1 week ago
What Causes Preventable Child Deaths?
-

 Energy1 week ago
Who’s Building the Most Solar Energy?
-

 Markets1 week ago
Mapped: The Most Valuable Company in Each Southeast Asian Country
-

 Technology1 week ago
Mapped: The Number of AI Startups By Country