Green
Interactive: EV Charging Stations Across the U.S. Mapped
![]() Subscribe to the Elements free mailing list for more like this
Subscribe to the Elements free mailing list for more like this
View the non-interactive version of this map here.
var divElement = document.getElementById(‘viz1660173746083’); var vizElement = divElement.getElementsByTagName(‘object’)[0]; vizElement.style.width=’1200px’;vizElement.style.height=’1227px’; var scriptElement = document.createElement(‘script’); scriptElement.src = ‘https://public.tableau.com/javascripts/api/viz_v1.js’; vizElement.parentNode.insertBefore(scriptElement, vizElement);

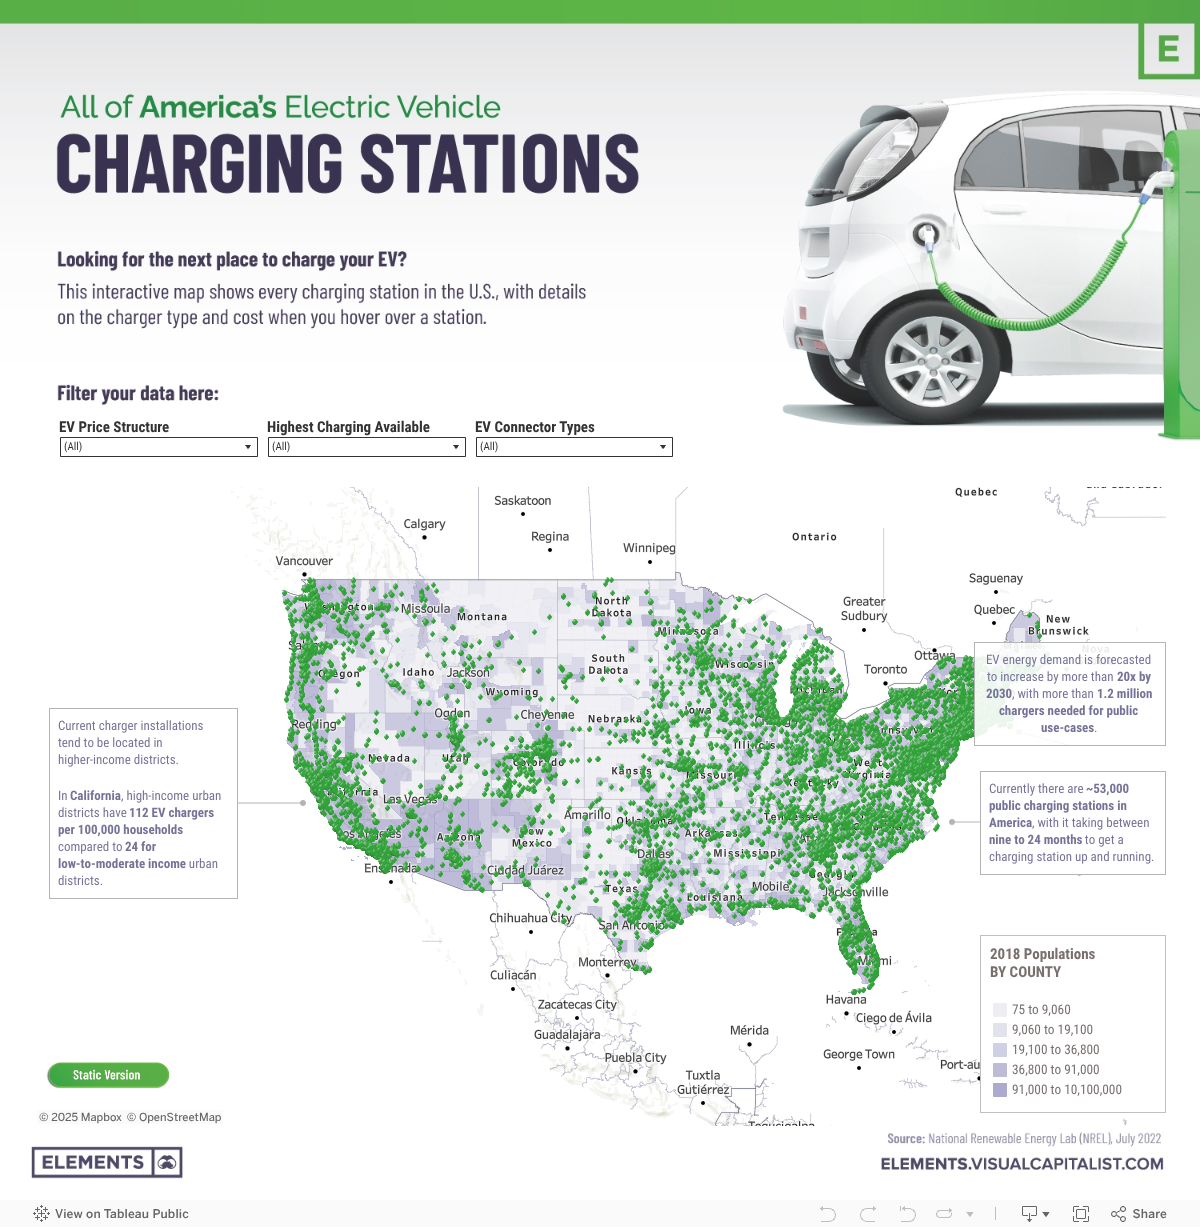
Electric Vehicle Charging Stations Across America: Mapped
This was originally posted on Elements. Sign up to the free mailing list to get beautiful visualizations on natural resource megatrends in your email every week.
As the electric vehicle market continues to expand, having enough EV charging stations is essential to enable longer driving ranges and lower wait times at chargers.
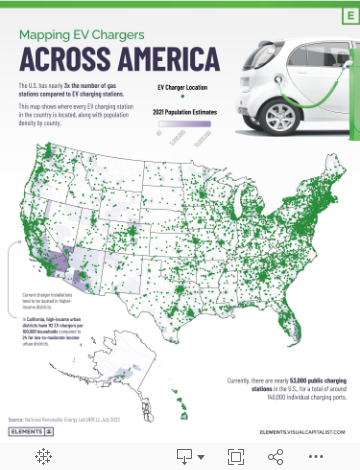
Currently, the U.S. has about 140,000 public EV chargers distributed across almost 53,000 charging stations, which are still far outnumbered by the 145,000 gas fueling stations in the country.
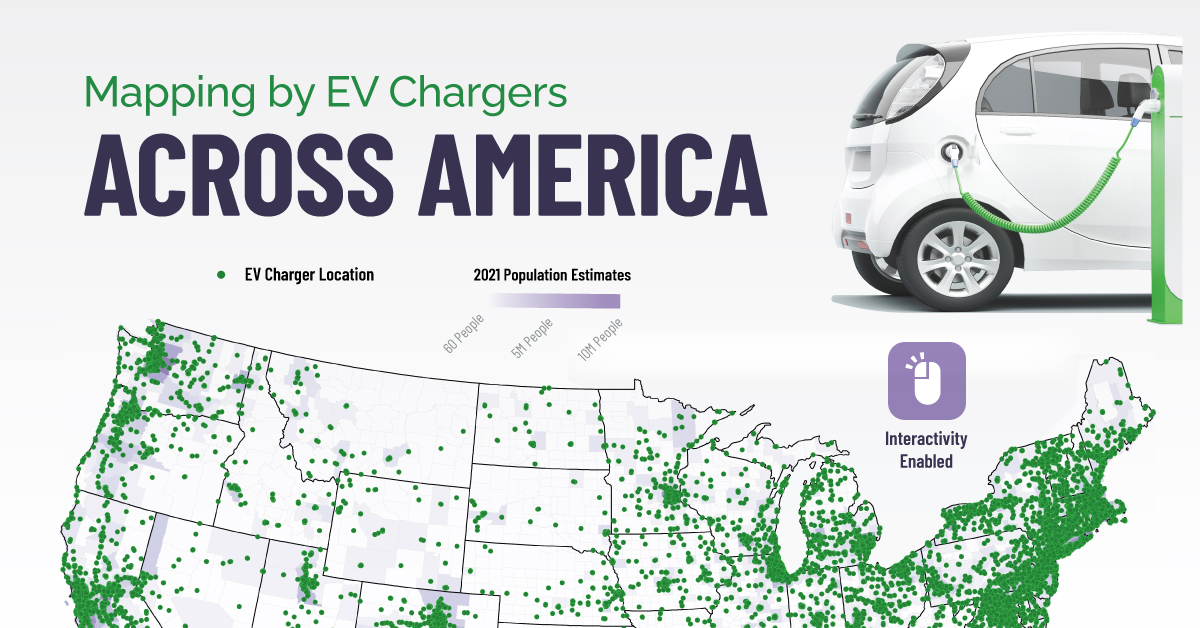
This graphic maps out EV charging stations across the U.S. using data from the National Renewable Energy Lab. The map has interactive features when viewed on desktop, showing pricing structures and the connector types when hovering over a charging station, along with filtering options.
Which States Lead in EV Charging Infrastructure?
As seen in the map above, most electric vehicle charging stations in the U.S. are located on the west and east coasts of the nation, while the Midwest strip is fairly barren aside from the state of Colorado.
California has the highest number of EV charging stations at 15,182, making up an impressive 29% of all charging stations in America. In fact, the Golden State has nearly double the chargers of the following three states, New York (3,085), Florida (2,858), and Texas (2,419) combined.
| Rank | State | Number of charging stations | Share of U.S. charging stations |
|---|---|---|---|
| 1 | California | 15,182 | 28.7% |
| 2 | New York | 3,085 | 5.8% |
| 3 | Florida | 2,858 | 5.4% |
| 4 | Texas | 2,419 | 4.6% |
| 5 | Massachusetts | 2,328 | 4.4% |
| 6 | Washington | 1,810 | 3.4% |
| 7 | Colorado | 1,718 | 3.2% |
| 8 | Georgia | 1,596 | 3.0% |
| 9 | Maryland | 1,358 | 2.6% |
| 10 | Pennsylvania | 1,260 | 2.4% |
| U.S. Total | 52,889 | 100.0% |
It’s no surprise the four top states by GDP have the highest number of EV chargers, and California’s significant lead is also unsurprising considering its ambition to completely phase out the sale of new gas vehicles by 2035.
The Best States for EV Charging Speeds and Cost
While having many charging stations distributed across a state is important, two other factors determine charging convenience: cost and charger level availability.
EV charger pricing structures and charger level availability across the nation are a Wild West with no set rules and few clear expectations.
Finding Free Electric Vehicle Chargers Across States
Generous electric vehicle charging locations will offer unlimited free charging or a time cap between 30 minutes and 4 hours of free charging before payment is required. Some EV charging stations located in parking structures simply require a parking fee, while others might have a flat charging fee per session, charge by kWh consumed, or have an hourly rate.
While California leads in terms of the raw amount of free chargers available in the state, it’s actually the second-worst in the top 10 states when it comes to the share of chargers, at only 11% of them free for 30 minutes or more.
| Rank | State name | Number of free charging stations | Share of free charging stations in the state |
|---|---|---|---|
| 1 | California | 1,717 | 11.3% |
| 2 | Florida | 673 | 23.6% |
| 3 | New York | 662 | 21.5% |
| 4 | Texas | 606 | 25.1% |
| 5 | Maryland | 399 | 29.4% |
| 6 | Georgia | 360 | 22.6% |
| 7 | Washington | 358 | 19.8% |
| 8 | Pennsylvania | 318 | 25.2% |
| 9 | Colorado | 273 | 15.9% |
| 10 | Massachusetts | 150 | 6.4% |
| U.S. Total | 10,295 | 19.5% |
Meanwhile, Maryland leads with almost 30% of the chargers in the state that offer a minimum of 30 minutes of free charging. On the other hand, Massachusetts is the stingiest state of the top 10, with only 6% of charging stations (150 total) in the state offering free charging for electric vehicle drivers.
The States with the Best DC Fast Charger Availability
While free EV chargers are great, having access to fast chargers can matter just as much, depending on how much you value your time. Most EV drivers across the U.S. will have access to level 2 chargers, with more than 86% of charging stations in the country having level 2 chargers available.
Although level 2 charging (4-10 hours from empty to full charge) beats the snail’s pace of level 1 charging (40-50 hours from empty to full charge), between busy schedules and many charging stations that are only free for the first 30 minutes, DC fast charger availability is almost a necessity.
Direct current fast chargers can charge an electric vehicle from empty to 80% in 20-60 minutes but are only available at 12% of America’s EV charging stations today.
| Rank | State | Number of stations with DC fast charger available | Share of DC fast charger available stations in state | Share of free and DC fast charger available stations in state |
|---|---|---|---|---|
| 1 | California | 1,756 | 11.6% | 0.7% |
| 2 | Florida | 360 | 12.6% | 1.1% |
| 3 | Texas | 276 | 11.4% | 1.2% |
| 4 | Colorado | 243 | 14.1% | 1.1% |
| 5 | New York | 234 | 7.6% | 0.8% |
| 6 | Washington | 232 | 12.8% | 1.1% |
| 7 | Georgia | 228 | 14.3% | 1.4% |
| 8 | Maryland | 223 | 16.4% | 2.7% |
| 9 | Pennsylvania | 134 | 10.6% | 1.0% |
| 10 | Massachusetts | 134 | 5.8% | 0.2% |
| U.S. Total | 6,540 | 12.4% | 0.9% |
Just like free stations, Maryland leads the top 10 states in having the highest share of DC fast chargers at 16%. While Massachusetts was the worst state for DC charger availability at 6%, the state of New York was second worst at 8% despite its large number of chargers overall. All other states in the top 10 have DC chargers available in at least one in 10 charging stations.
As for the holy grail of charging stations, with free charging and DC fast charger availability, almost 1% of the country’s charging stations are there. So if you’re hoping for free and DC fast charging, the chances in most states are around one in 100.
The Future of America’s EV Charging Infrastructure
As America works towards Biden’s goal of having half of all new vehicles sold in 2030 be zero-emissions vehicles (battery electric, plug-in hybrid electric, or fuel cell electric), charging infrastructure across the nation is essential in improving accessibility and convenience for drivers.
The Biden administration has given early approval to 35 states’ EV infrastructure plans, granting them access to $900 million in funding as part of the $5 billion National Electric Vehicle Infrastructure (NEVI) Formula Program set to be distributed over the next five years.
Along with this program, a $2.5 billion Discretionary Grant Program aims to increase EV charging access in rural, undeserved, and overburdened communities, along with the Inflation Reduction Act’s $3 billion dedicated to supporting access to EV charging for economically disadvantaged communities.
With more than $10 billion being invested into EV charging infrastructure over the next five years and more than half the sum focused on communities with poor current access, charger availability across America is set to continue improving in the coming years.


Automotive
How People Get Around in America, Europe, and Asia
Examining how people get around using cars, public transit, and walking or biking, and the regional differences in usage.


How People Get Around in America, Europe, and Asia
This was originally posted on our Voronoi app. Download the app for free on iOS or Android and discover incredible data-driven charts from a variety of trusted sources.
This chart highlights the popularity of different transportation types in the Americas, Europe, and Asia, calculated by modal share.
Data for this article and visualization is sourced from ‘The ABC of Mobility’, a research paper by Rafael Prieto-Curiel (Complexity Science Hub) and Juan P. Ospina (EAFIT University), accessed through ScienceDirect.
The authors gathered their modal share data through travel surveys, which focused on the primary mode of transportation a person employs for each weekday trip. Information from 800 cities across 61 countries was collected for this study.
North American Car Culture Contrasts with the Rest of the World
In the U.S. and Canada, people heavily rely on cars to get around, no matter the size of the city. There are a few exceptions of course, such as New York, Toronto, and smaller college towns across the United States.
| Region | 🚗 Cars | 🚌 Public Transport | 🚶 Walking/Biking |
|---|---|---|---|
| North America* | 92% | 5% | 4% |
| Central America | 23% | 42% | 35% |
| South America | 29% | 40% | 31% |
| Northern Europe | 48% | 29% | 24% |
| Western Europe | 43% | 24% | 34% |
| Southern Europe | 50% | 24% | 25% |
| Eastern Europe | 35% | 40% | 25% |
| Southeastern Asia | 44% | 43% | 13% |
| Western Asia | 43% | 28% | 29% |
| Southern Asia | 22% | 39% | 39% |
| Eastern Asia | 19% | 46% | 35% |
| World | 51% | 26% | 22% |
Note: *Excluding Mexico. Percentages are rounded.
As a result, North America’s share of public transport and active mobility (walking and biking) is the lowest amongst all surveyed regions by a significant amount.
On the other hand, public transport reigns supreme in South and Central America as well as Southern and Eastern Asia. It ties with cars in Southeastern Asia, and is eclipsed by cars in Western Asia.
As outlined in the paper, Europe sees more city-level differences in transport popularity.
For example, Utrecht, Netherlands prefers walking and biking. People in Paris and London like using their extensive transit systems. And in Manchester and Rome, roughly two out of three journeys are by car.

-

 Markets5 days ago
Mapped: The Most Valuable Company in Each Southeast Asian Country
-

 Markets2 weeks ago
The Top Private Equity Firms by Country
-

 Jobs2 weeks ago
The Best U.S. Companies to Work for According to LinkedIn
-

 Economy2 weeks ago
Ranked: The Top 20 Countries in Debt to China
-

 Politics1 week ago
Charted: Trust in Government Institutions by G7 Countries
-

 Energy1 week ago
Mapped: The Age of Energy Projects in Interconnection Queues, by State
-

 Mining1 week ago
Visualizing Global Gold Production in 2023
-

 Markets1 week ago
Visualized: Interest Rate Forecasts for Advanced Economies