Misc
12 Different Ways to Organize the Periodic Table of Elements


The Periodic Tables You’ve Never Seen Before
The Periodic Table of Elements is an iconic image in classrooms and laboratories all around the world.
Yet despite having an almost unanimous agreement amongst scientists on its composition, there are over 1,000 different periodic tables—and that number continues to grow. This is because the standard table does not highlight all of the existing relationships between the elements.
With 118 elements currently known, there are many different interactions and stories to tell. Here are some of the most remarkable, fascinating and bizarre periodic tables that we could find.
Purpose and Properties of the Periodic Table
To understand why there are so many periodic tables, we first need to understand exactly what a periodic table is. “Periodic” tables get their name because they organize the chemical elements by periodicity (or recurring periodic patterns).
When the elements are organized by their relatively stable number of protons, for example, we get the standard periodic table of elements first devised by Russian chemist Dmitri Mendeleev in the year 1869.

Compared to protons, electrons are very mobile. The way electrons are configured around a nucleus—and how they behave with the electrons of other elements—gives them specific chemical properties.
These properties are similar amongst some elements and repeat periodically. The standard periodic table of elements visualizes this by arranging elements based on these shared chemical properties, providing a guide for understanding similar electron configurations at a glance.
Examining Different Periodic Tables
Below are just a few of the most interesting and unique periodic table permutations not commonly used.
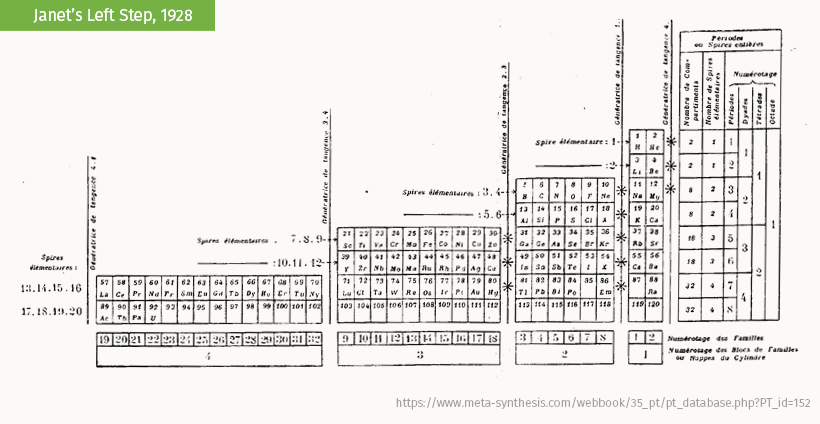
Charles Janet’s “left-step” periodic table is the most popular alternative table. It organizes the elements by the way that electrons fill orbitals (the regions they whir in) rather than valence (an electron’s ability to bond).
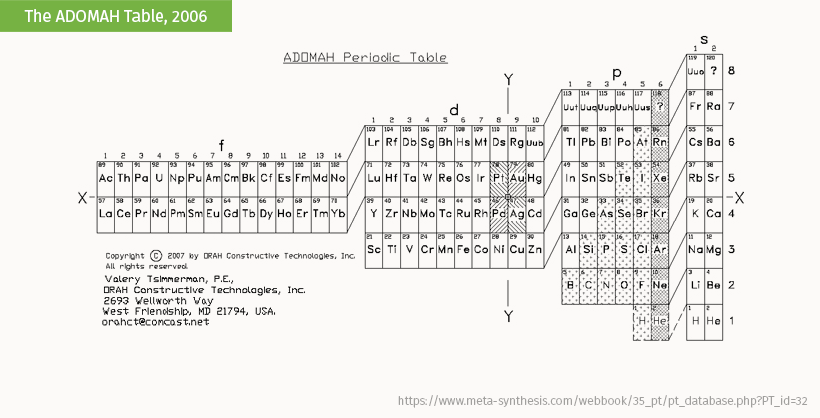
The ADOMAH table by Valery Tsimmerman is a form of the left-step table that groups elements by their principal quantum number.
The Physicist’s Periodic Table of Elements by Timothy Stowe rearranges the standard table into both 3D-vertical (A) and 2D-horizontal (B) layouts. When merged with the work of Charles Janet and Eric Scerri (C) the result is a unique map of chemical groups.

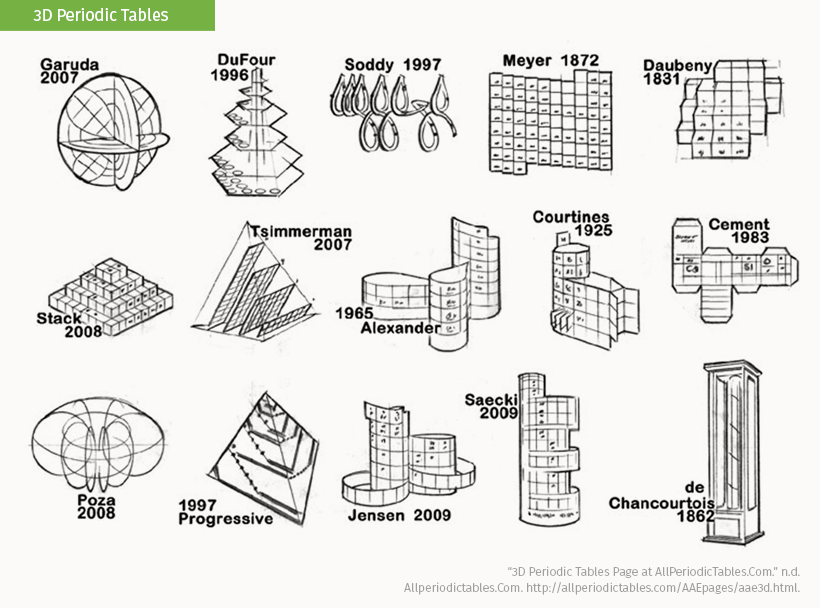
Many researchers and scholars also continue to come up with new ways to show the basics of chemical periodicity.
One method is in three-dimensional interpretations of periodicity. Here’s a collection of some of the most well-known designs and their creators, including the Telluric Screw and the Alexander Arrangement from the main graphic above.
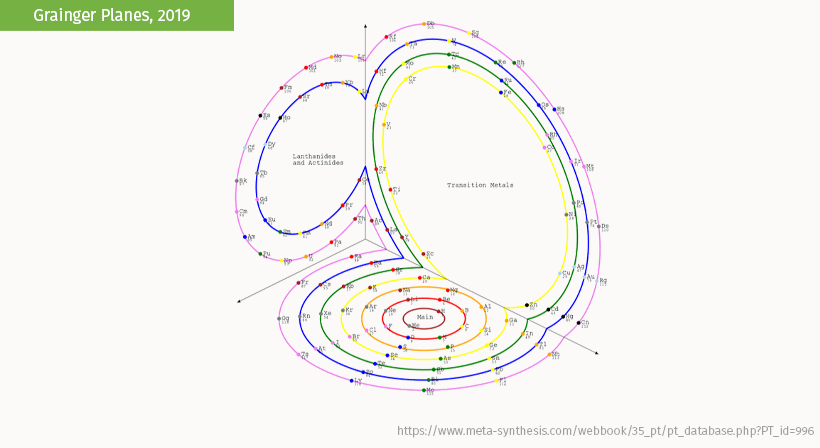
This representation by Anthony Grainger imagines all periods aligning along orthogonal (right-angle) planes cutting a sphere.
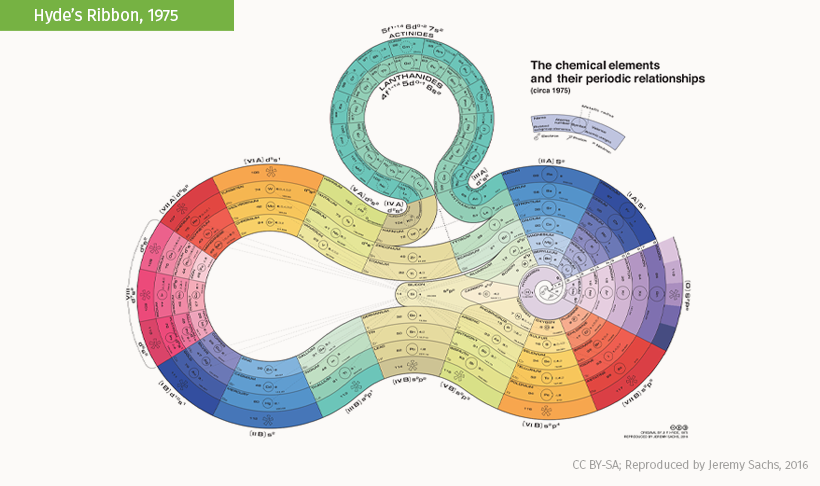
This eye-catching arrangement by Franklin J. Hyde winds a linear count of the elements while putting silicon at center stage.
Not all periodic tables show periodicity like the standard periodic table. Depending on the message, the chemical elements can take on various unique and exciting ways to tell a different kind of story.
This flowchart from Linus Pauling’s “General Chemistry” (A) organizes elements by the energy levels of their electron shells and subshells. On the other hand, Gooch & Walker’s Spiral (B) is a figure-8 representation that is almost entirely devoid of most atomic information common to other periodic tables.

The spiral periodic table known as the Periodic Snail by Theodor Benfey swirls outwards by atomic number before branching into additional groups. The unique aspect of this table is that it reserves space for a hypothesized family of elements, the superactinides, and how they might correlate with the rest of the elements.

These are just a few of the hundreds and thousands of different ways to examine the elements.
As contemporary research continues to break new ground in our understanding of the elements, the opportunities to see the periodic table take on more new forms are shaping an exciting future for chemistry lovers and and data visualizers alike.
For more variations and designs of the periodic table, please visit Dr. Mark R. Leach’s online database at The Chemogenesis Web Book.


Misc
The Top 25 Nationalities of U.S. Immigrants
Mexico is the largest source of immigrants to the U.S., with almost 11 million immigrants.


The Top 25 Nationalities of U.S. Immigrants
This was originally posted on our Voronoi app. Download the app for free on iOS or Android and discover incredible data-driven charts from a variety of trusted sources.
The United States is home to more than 46 million immigrants, constituting approximately 14% of its total population.
This graphic displays the top 25 countries of origin for U.S. immigrants, based on 2022 estimates. The data is sourced from the Migration Policy Institute (MPI), which analyzed information from the U.S. Census Bureau’s 2022 American Community Survey.
In this context, “immigrants” refer to individuals residing in the United States who were not U.S. citizens at birth.
Mexico Emerges as a Leading Source of Immigration
Mexico stands out as the largest contributor to U.S. immigration due to its geographical proximity and historical ties.
Various economic factors, including wage disparities and employment opportunities, motivate many Mexicans to seek better prospects north of the border.
| Country | Region | # of Immigrants |
|---|---|---|
| 🇲🇽 Mexico | Latin America & Caribbean | 10,678,502 |
| 🇮🇳 India | Asia | 2,839,618 |
| 🇨🇳 China | Asia | 2,217,894 |
| 🇵🇭 Philippines | Asia | 1,982,333 |
| 🇸🇻 El Salvador | Latin America & Caribbean | 1,407,622 |
| 🇻🇳 Vietnam | Asia | 1,331,192 |
| 🇨🇺 Cuba | Latin America & Caribbean | 1,312,510 |
| 🇩🇴 Dominican Republic | Latin America & Caribbean | 1,279,900 |
| 🇬🇹 Guatemala | Latin America & Caribbean | 1,148,543 |
| 🇰🇷 Korea | Asia | 1,045,100 |
| 🇨🇴 Colombia | Latin America & Caribbean | 928,053 |
| 🇭🇳 Honduras | Latin America & Caribbean | 843,774 |
| 🇨🇦 Canada | Northern America | 821,322 |
| 🇯🇲 Jamaica | Latin America & Caribbean | 804,775 |
| 🇭🇹 Haiti | Latin America & Caribbean | 730,780 |
| 🇬🇧 United Kingdom | Europe | 676,652 |
| 🇻🇪 Venezuela | Latin America & Caribbean | 667,664 |
| 🇧🇷 Brazil | Latin America & Caribbean | 618,525 |
| 🇩🇪 Germany | Europe | 537,484 |
| 🇪🇨 Ecuador | Latin America & Caribbean | 518,287 |
| 🇵🇪 Peru | Latin America & Caribbean | 471,988 |
| 🇳🇬 Nigeria | Africa | 448,405 |
| 🇺🇦 Ukraine | Europe | 427,163 |
| 🇮🇷 Iran | Middle East | 407,283 |
| 🇵🇰 Pakistan | Asia | 399,086 |
| Rest of World | 11,637,634 | |
| Total | 46,182,089 |
Mexicans are followed in this ranking by Indians, Chinese, and Filipinos, though most immigrants on this list come from countries in the Latin American and Caribbean region.
On the other hand, only three European countries are among the top sources of U.S. immigrants: the UK, Germany, and Ukraine.
Immigration continues to be a significant factor contributing to the overall growth of the U.S. population. Overall population growth has decelerated over the past decade primarily due to declining birth rates.
Between 2021 and 2022, the increase in the immigrant population accounted for 65% of the total population growth in the U.S., representing 912,000 individuals out of nearly 1.4 million.
If you enjoyed this post, be sure to check out Visualized: Why Do People Immigrate to the U.S.? This visualization shows the different reasons cited by new arrivals to America in 2021.

-

 Personal Finance1 week ago
Visualizing the Tax Burden of Every U.S. State
-

 Misc6 days ago
Visualized: Aircraft Carriers by Country
-

 Culture6 days ago
How Popular Snack Brand Logos Have Changed
-

 Mining1 week ago
Visualizing Copper Production by Country in 2023
-

 Misc1 week ago
Charted: How Americans Feel About Federal Government Agencies
-

 Healthcare1 week ago
Which Countries Have the Highest Infant Mortality Rates?
-

 Demographics1 week ago
Mapped: U.S. Immigrants by Region
-

 Maps1 week ago
Mapped: Southeast Asia’s GDP Per Capita, by Country