Technology
Which Country Has the Best Digital Well-Being in 2023?
Article/Editing:
Which Country Has the Best Digital Well-Being in 2023?
The average person spends close to seven hours every day looking at a screen, whether for work, entertainment, or communication, highlighting how digital human life has become.
And just like how physical well-being differs from place to place, so too does digital well-being.
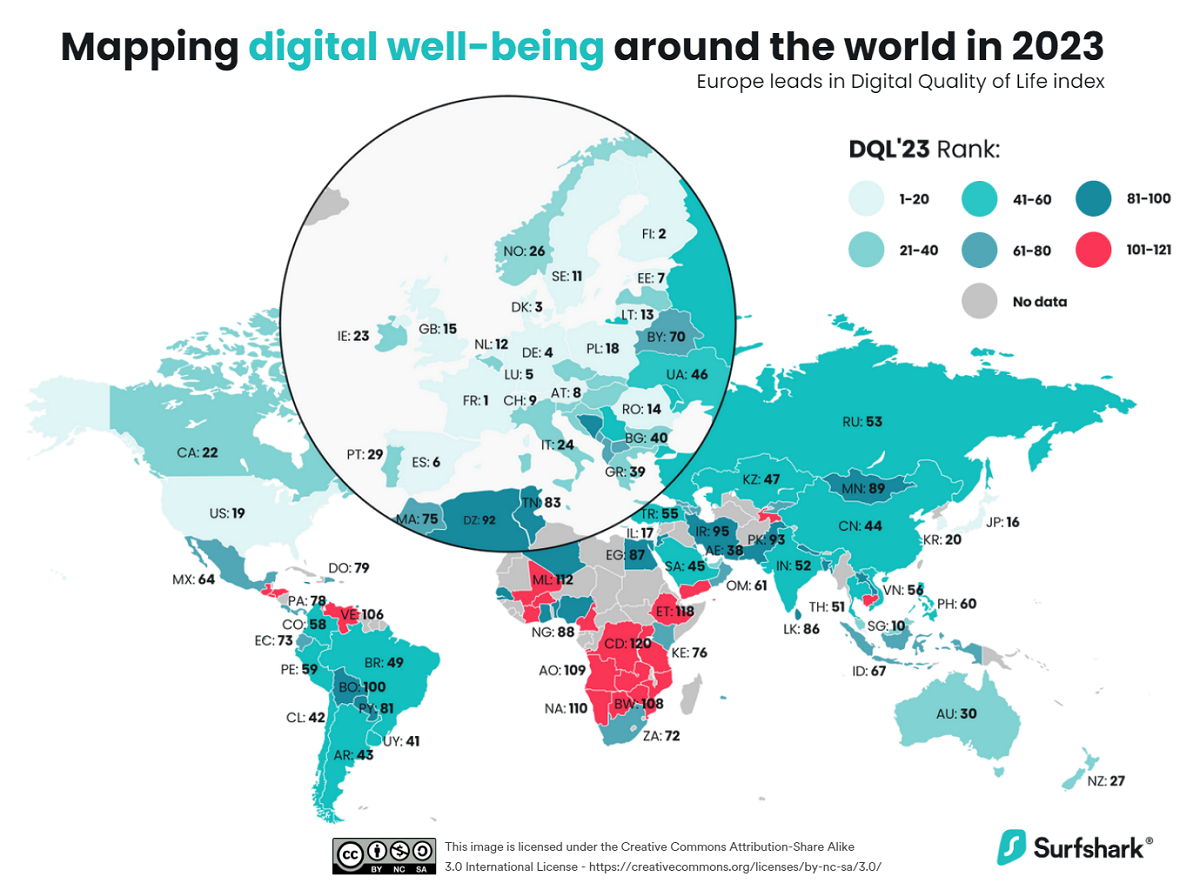
According to SurfShark’s 2023, Digital Quality of Life Index, some countries do a better job than others in providing accessible, and affordable internet and digital services, leading to better digital well-being.
They rank 121 countries (amounting to 92% of the world’s population) on five key metrics:
- Internet affordability: How long do people have to work to afford a stable internet connection? More affordable internet has a positive effect on digital well-being.
- Internet quality: How fast and stable is internet connectivity? Fast and stable internet helps communication, work-efficiency, and consumption of high-quality content.
- E-infrastructure: How developed and inclusive the existing electronic infrastructure is, allowing internet use for varied activities.
- E-security: Ability to counter cybercrimes and protect online privacy.
- E-government: Digitization of government services, minimizing bureaucracy and corruption, and increasing transparency.
They assign scores on each indicator, which weighted equally, creates one rank for each country. Visit SurfShark’s methodology section for their detailed breakdown of sources, scores, and rankings.
Ranking Countries By Digital Well-Being in 2023
The tagline of the 2023 report is “Europe leads the Digital Quality of Life Index.” This is because the first nine spots of the digital well-being ranks go to European countries.
They’re led by France which ranks first in internet affordability, fifth in quality, and has a top-20 ranking in electronic infrastructure, security, and government.
Here’s the full breakdown of each country’s overall rank, as well as their per metric rank.
| Rank | Country | Internet Affordability | Internet Quality | E-Infrastructure | E-Security | E-Govt |
|---|---|---|---|---|---|---|
| 1 | 🇫🇷 France | 1 | 5 | 16 | 13 | 11 |
| 2 | 🇫🇮 Finland | 11 | 24 | 8 | 11 | 3 |
| 3 | 🇩🇰 Denmark | 29 | 4 | 2 | 13 | 5 |
| 4 | 🇩🇪 Germany | 7 | 40 | 12 | 5 | 22 |
| 5 | 🇱🇺 Luxembourg | 2 | 31 | 11 | 26 | 23 |
| 6 | 🇪🇸 Spain | 14 | 9 | 26 | 9 | 21 |
| 7 | 🇪🇪 Estonia | 17 | 44 | 15 | 2 | 6 |
| 8 | 🇦🇹 Austria | 5 | 66 | 24 | 11 | 15 |
| 9 | 🇨🇭 Switzerland | 9 | 7 | 3 | 29 | 29 |
| 10 | 🇸🇬 Singapore | 4 | 3 | 9 | 56 | 1 |
| 11 | 🇸🇪 Sweden | 25 | 27 | 1 | 13 | 13 |
| 12 | 🇳🇱 Netherlands | 38 | 18 | 4 | 16 | 10 |
| 13 | 🇱🇹 Lithuania | 18 | 23 | 25 | 2 | 30 |
| 14 | 🇷🇴 Romania | 3 | 12 | 61 | 6 | 62 |
| 15 | 🇬🇧 UK | 22 | 32 | 13 | 23 | 8 |
| 16 | 🇯🇵 Japan | 15 | 25 | 14 | 33 | 9 |
| 17 | 🇮🇱 Israel | 21 | 17 | 21 | 32 | 18 |
| 18 | 🇵🇱 Poland | 24 | 22 | 37 | 10 | 37 |
| 19 | 🇺🇸 U.S. | 32 | 6 | 5 | 43 | 2 |
| 20 | 🇰🇷 South Korea | 31 | 64 | 7 | 31 | 4 |
| 21 | 🇧🇪 Belgium | 43 | 47 | 23 | 1 | 39 |
| 22 | 🇨🇦 Canada | 51 | 2 | 10 | 37 | 12 |
| 23 | 🇮🇪 Ireland | 44 | 36 | 22 | 20 | 26 |
| 24 | 🇮🇹 Italy | 47 | 33 | 30 | 19 | 19 |
| 25 | 🇨🇿 Czechia | 27 | 45 | 31 | 4 | 48 |
| 26 | 🇳🇴 Norway | 56 | 43 | 6 | 24 | 20 |
| 27 | 🇳🇿 New Zealand | 19 | 46 | 18 | 36 | 14 |
| 28 | 🇱🇻 Latvia | 39 | 20 | 39 | 20 | 38 |
| 29 | 🇵🇹 Portugal | 84 | 28 | 32 | 6 | 27 |
| 30 | 🇦🇺 Australia | 8 | 72 | 20 | 41 | 7 |
| 31 | 🇨🇾 Cyprus | 20 | 59 | 27 | 26 | 42 |
| 32 | 🇲🇹 Malta | 49 | 34 | 19 | 30 | 25 |
| 33 | 🇸🇰 Slovakia | 33 | 41 | 38 | 16 | 59 |
| 34 | 🇭🇺 Hungary | 59 | 15 | 44 | 24 | 45 |
| 35 | 🇸🇮 Slovenia | 50 | 39 | 34 | 28 | 28 |
| 36 | 🇭🇷 Croatia | 41 | 68 | 40 | 16 | 56 |
| 37 | 🇲🇾 Malaysia | 26 | 13 | 33 | 48 | 32 |
| 38 | 🇦🇪 UAE | 63 | 1 | 17 | 90 | 17 |
| 39 | 🇬🇷 Greece | 75 | 81 | 60 | 6 | 46 |
| 40 | 🇧🇬 Bulgaria | 36 | 89 | 75 | 22 | 55 |
| 41 | 🇺🇾 Uruguay | 55 | 49 | 42 | 35 | 49 |
| 42 | 🇨🇱 Chile | 61 | 11 | 35 | 49 | 31 |
| 43 | 🇦🇷 Argentina | 83 | 35 | 48 | 33 | 40 |
| 44 | 🇨🇳 China | 34 | 10 | 49 | 79 | 16 |
| 45 | 🇸🇦 Saudi Arabia | 74 | 58 | 28 | 42 | 34 |
| 46 | 🇺🇦 Ukraine | 53 | 75 | 41 | 39 | 51 |
| 47 | 🇰🇿 Kazakhstan | 10 | 61 | 53 | 86 | 44 |
| 48 | 🇶🇦 Qatar | 46 | 19 | 29 | 67 | 58 |
| 49 | 🇧🇷 Brazil | 76 | 8 | 51 | 79 | 24 |
| 50 | 🇷🇸 Serbia | 60 | 54 | 65 | 38 | 43 |
| 51 | 🇹🇭 Thailand | 91 | 14 | 47 | 60 | 36 |
| 52 | 🇮🇳 India | 28 | 16 | 91 | 66 | 35 |
| 53 | 🇷🇺 Russia | 69 | 51 | 46 | 56 | 47 |
| 54 | 🇲🇩 Moldova | 30 | 29 | 76 | 52 | 69 |
| 55 | 🇹🇷 Turkey | 65 | 77 | 50 | 53 | 33 |
| 56 | 🇻🇳 Vietnam | 16 | 30 | 57 | 94 | 63 |
| 57 | 🇧🇭 Bahrain | 57 | 48 | 36 | 68 | 57 |
| 58 | 🇨🇴 Colombia | 66 | 42 | 63 | 54 | 50 |
| 59 | 🇵🇪 Peru | 100 | 37 | 64 | 46 | 54 |
| 60 | 🇵🇭 Philippines | 104 | 21 | 54 | 45 | 64 |
| 61 | 🇴🇲 Oman | 40 | 74 | 43 | 88 | 53 |
| 62 | 🇨🇷 Costa Rica | 82 | 52 | 52 | 59 | 71 |
| 63 | 🇰🇼 Kuwait | 35 | 26 | 45 | 104 | 66 |
| 64 | 🇲🇽 Mexico | 93 | 56 | 59 | 70 | 52 |
| 65 | 🇬🇪 Georgia | 48 | 102 | 55 | 43 | 80 |
| 66 | 🇲🇰 North Macedonia | 67 | 76 | 71 | 50 | 68 |
| 67 | 🇮🇩 Indonesia | 90 | 90 | 72 | 61 | 41 |
| 68 | 🇦🇱 Albania | 98 | 79 | 78 | 46 | 60 |
| 69 | 🇦🇲 Armenia | 42 | 87 | 74 | 74 | 70 |
| 70 | 🇧🇾 Belarus | 37 | 71 | 62 | 76 | 86 |
| 71 | 🇰🇬 Kyrgyzstan | 6 | 88 | 98 | 93 | 85 |
| 72 | 🇿🇦 South Africa | 52 | 63 | 94 | 72 | 61 |
| 73 | 🇪🇨 Ecuador | 96 | 50 | 70 | 76 | 72 |
| 74 | 🇦🇿 Azerbaijan | 87 | 93 | 66 | 64 | 78 |
| 75 | 🇲🇦 Morocco | 72 | 94 | 87 | 40 | 90 |
| 76 | 🇰🇪 Kenya | 97 | 92 | 68 | 65 | 75 |
| 77 | 🇲🇪 Montenegro | 70 | 96 | 56 | 74 | 81 |
| 78 | 🇵🇦 Panama | 109 | 38 | 79 | 81 | 74 |
| 79 | 🇩🇴 Dominican Republic | 106 | 73 | 81 | 56 | 79 |
| 80 | 🇲🇺 Mauritius | 95 | 101 | 83 | 63 | 67 |
| 81 | 🇵🇾 Paraguay | 105 | 53 | 77 | 61 | 84 |
| 82 | 🇧🇩 Bangladesh | 77 | 65 | 84 | 85 | 73 |
| 83 | 🇹🇳 Tunisia | 79 | 106 | 89 | 54 | 77 |
| 84 | 🇧🇦 Bosnia & Herzegovina | 54 | 100 | 73 | 87 | 97 |
| 85 | 🇯🇴 Jordan | 107 | 55 | 67 | 110 | 65 |
| 86 | 🇱🇰 Sri Lanka | 13 | 99 | 103 | 100 | 87 |
| 87 | 🇪🇬 Egypt | 102 | 83 | 96 | 68 | 76 |
| 88 | 🇳🇬 Nigeria | 108 | 62 | 93 | 73 | 88 |
| 89 | 🇲🇳 Mongolia | 85 | 105 | 69 | 102 | 82 |
| 90 | 🇹🇹 Trinidad & Tobago | 117 | 60 | 80 | 95 | 95 |
| 91 | 🇯🇲 Jamaica | 115 | 78 | 86 | 89 | 94 |
| 92 | 🇩🇿 Algeria | 81 | 91 | 82 | 95 | 107 |
| 93 | 🇵🇰 Pakistan | 45 | 97 | 101 | 101 | 83 |
| 94 | 🇵🇹 Nepal | 58 | 85 | 95 | 98 | 104 |
| 95 | 🇮🇷 Iran | 68 | 104 | 58 | 120 | 92 |
| 96 | 🇬🇭 Ghana | 103 | 86 | 108 | 83 | 89 |
| 97 | 🇱🇦 Laos | 23 | 80 | 97 | 102 | 115 |
| 98 | 🇧🇯 Benin | 114 | 107 | 114 | 50 | 93 |
| 99 | 🇸🇳 Senegal | 80 | 110 | 99 | 91 | 100 |
| 100 | 🇧🇴 Bolivia | 89 | 103 | 90 | 108 | 98 |
| 101 | 🇸🇻 El Salvador | 113 | 69 | 88 | 114 | 103 |
| 102 | 🇿🇲 Zambia | 64 | 120 | 107 | 71 | 106 |
| 103 | 🇨🇮 Ivory Coast | 119 | 112 | 109 | 83 | 96 |
| 104 | 🇬🇹 Guatemala | 112 | 57 | 100 | 114 | 91 |
| 105 | 🇰🇭 Cambodia | 92 | 84 | 85 | 119 | 108 |
| 106 | 🇻🇪 Venezuela | 88 | 70 | 92 | 110 | 117 |
| 107 | 🇺🇬 Uganda | 116 | 108 | 112 | 81 | 99 |
| 108 | 🇧🇼 Botswana | 78 | 98 | 104 | 97 | 112 |
| 109 | 🇦🇴 Angola | 12 | 116 | 116 | 112 | 109 |
| 110 | 🇳🇦 Namibia | 86 | 115 | 110 | 98 | 102 |
| 111 | 🇧🇫 Burkina Faso | 99 | 67 | 117 | 78 | 114 |
| 112 | 🇲🇱 Mali | 121 | 114 | 105 | 91 | 113 |
| 113 | 🇹🇿 Tanzania | 101 | 95 | 111 | 114 | 101 |
| 114 | 🇭🇳 Honduras | 111 | 82 | 102 | 118 | 119 |
| 115 | 🇿🇼 Zimbabwe | 120 | 111 | 106 | 105 | 111 |
| 116 | 🇨🇲 Cameroon | 118 | 113 | 113 | 106 | 110 |
| 117 | 🇹🇯 Tajikistan | 110 | 119 | 115 | 109 | 105 |
| 118 | 🇪🇹 Ethiopia | 71 | 117 | 119 | 106 | 116 |
| 119 | 🇲🇿 Mozambique | 94 | 109 | 118 | 112 | 118 |
| 120 | 🇨🇩 DRC | 73 | 118 | 121 | 117 | 121 |
| 121 | 🇾🇪 Yemen | 62 | 121 | 120 | 121 | 120 |
Singapore, at 10th, is the highest ranked non-European country on the digital well-being index, followed by Japan at 16th.
Last year’s top-scoring country, Israel drops down to 17th in this edition, and the U.S., and South Korea round out the top 20.
Trends in Digital Quality of Life
Surfshark’s extensive number-crunching allowed them to generate a few deeper insights.
While it is true that wealthier nations generally have better digital well-being—because of the money available to invest in improving key metrics—Surfshark found 22 countries that exceeded expectations in their per-capita GDP bracket. Their higher scores in electronic security, infrastructure, and government improved their overall digital well-being rank.
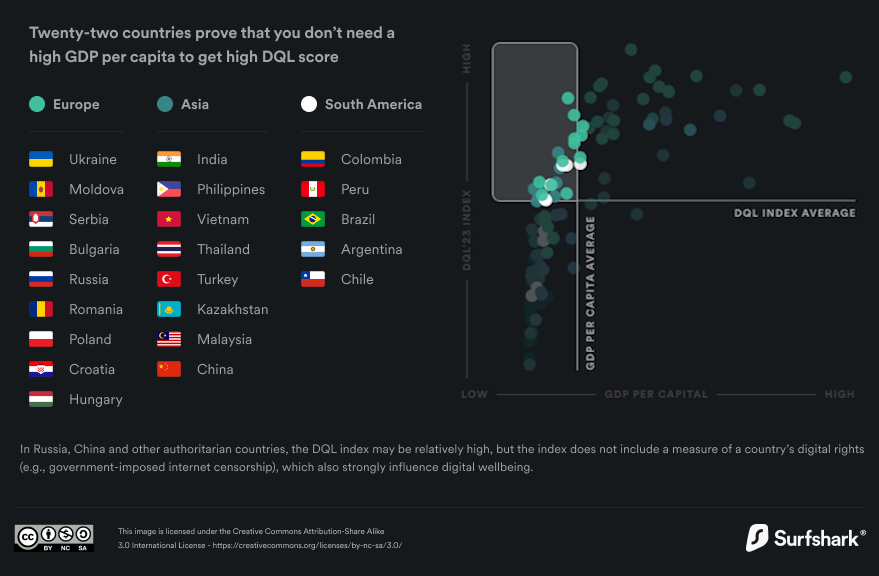
A majority of these nations are from Asia and Eastern Europe: Philippines, Vietnam, Ukraine, Moldova, Thailand, Serbia, Croatia to name a few.
In fact, SurfShark also found that improving e-government scores particularly had the strongest correlation (0.94) with a better digital quality of life. On the other hand, internet affordability demonstrated the lowest correlation with overall digital well-being, at 0.67.
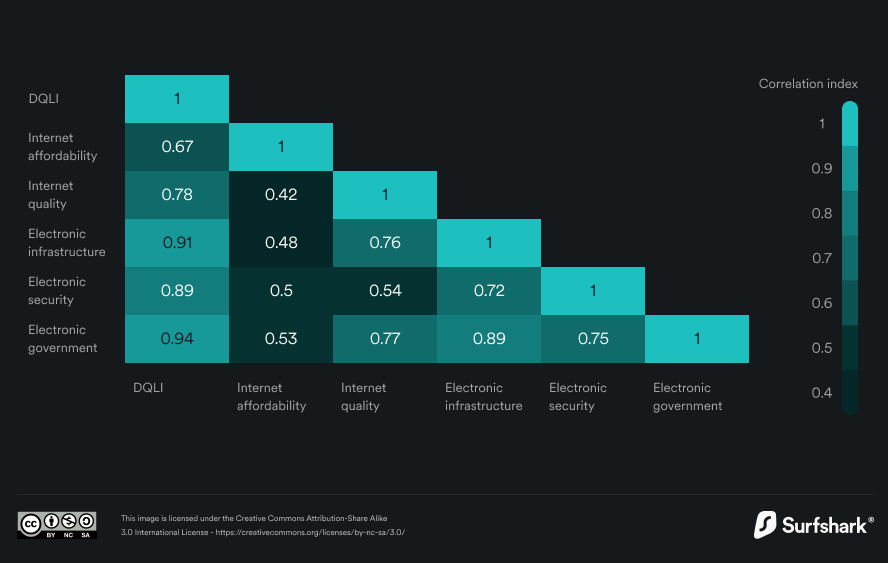
This underscores the outsized role in providing other services through the internet, as opposed to just improving the internet itself.

This article was published as a part of Visual Capitalist's Creator Program, which features data-driven visuals from some of our favorite Creators around the world.


Technology
Countries With the Highest Rates of Crypto Ownership
While the U.S. is a major market for cryptocurrencies, two countries surpass it in terms of their rates of crypto ownership.


Countries With the Highest Rates of Crypto Ownership
This was originally posted on our Voronoi app. Download the app for free on iOS or Android and discover incredible data-driven charts from a variety of trusted sources.
This graphic ranks the top 10 countries by their rate of cryptocurrency ownership, which is the percentage of the population that owns crypto. These figures come from crypto payment gateway, Triple-A, and are as of 2023.
Data and Highlights
The table below lists the rates of crypto ownership in the top 10 countries, as well as the number of people this amounts to.
| Country | % of Population Who Own Crypto | # of Crypto Owners |
|---|---|---|
| 🇦🇪 United Arab Emirates | 30.4 | 3M |
| 🇻🇳 Vietnam | 21.2 | 21M |
| 🇺🇸 U.S. | 15.6 | 53M |
| 🇮🇷 Iran | 13.5 | 12M |
| 🇵🇭 Philippines | 13.4 | 16M |
| 🇧🇷 Brazil | 12 | 26M |
| 🇸🇦 Saudi Arabia | 11.4 | 4M |
| 🇸🇬 Singapore | 11.1 | 665K |
| 🇺🇦 Ukraine | 10.6 | 4M |
| 🇻🇪 Venezuela | 10.3 | 3M |
Note that if we were to rank countries based on their actual number of crypto owners, India would rank first at 93 million people, China would rank second at 59 million people, and the U.S. would rank third at 52 million people.
The UAE Takes the Top Spot
The United Arab Emirates (UAE) boasts the highest rates of crypto ownership globally. The country’s government is considered to be very crypto friendly, as described in Henley & Partners’ Crypto Wealth Report 2023:
In the UAE, the Financial Services Regulatory Authority (FSRA-ADGM) was the first to provide rules and regulations regarding cryptocurrency purchasing and selling. The Emirates are generally very open to new technologies and have proposed zero taxes for crypto owners and businesses.
Vietnam leads Southeast Asia
According to the Crypto Council for Innovation, cryptocurrency holdings in Vietnam are also untaxed, making them an attractive asset.
Another reason for Vietnam’s high rates of ownership could be its large unbanked population (people without access to financial services). Cryptocurrencies may provide an alternative means of accessing these services without relying on traditional banks.
Learn More About Crypto From Visual Capitalist
If you enjoyed this post, be sure to check out The World’s Largest Corporate Holders of Bitcoin, which ranks the top 12 publicly traded companies by their Bitcoin holdings.

-

 Energy4 days ago
Who’s Building the Most Solar Energy?
-

 Wealth2 weeks ago
Charted: Which Country Has the Most Billionaires in 2024?
-

 Markets2 weeks ago
The Top Private Equity Firms by Country
-

 Jobs2 weeks ago
The Best U.S. Companies to Work for According to LinkedIn
-

 Economy1 week ago
Ranked: The Top 20 Countries in Debt to China
-

 Misc1 week ago
Charted: Trust in Government Institutions by G7 Countries
-

 Energy1 week ago
Mapped: The Age of Energy Projects in Interconnection Queues, by State
-

 Mining1 week ago
Visualizing Global Gold Production in 2023