Technology
Visualizing the R&D Investment of the 10 Biggest Nasdaq Companies
Article/Editing:
R&D Investment of the 10 Biggest Nasdaq Companies
Over the last decade, Apple’s research and development (R&D) spending has jumped from about $3 billion to over $26 billion.
The world’s largest company, like other tech giants, is investing heavily in R&D on the heels of AI disruption and the rapid speed of innovation. As these technologies become more pervasive in our daily lives, so too has investment in R&D across major companies.
This graphic from Trendline shows the scale at which the 10 biggest companies listed on the Nasdaq are spending on R&D.
R&D Investment by the 10 Biggest Nasdaq Firms
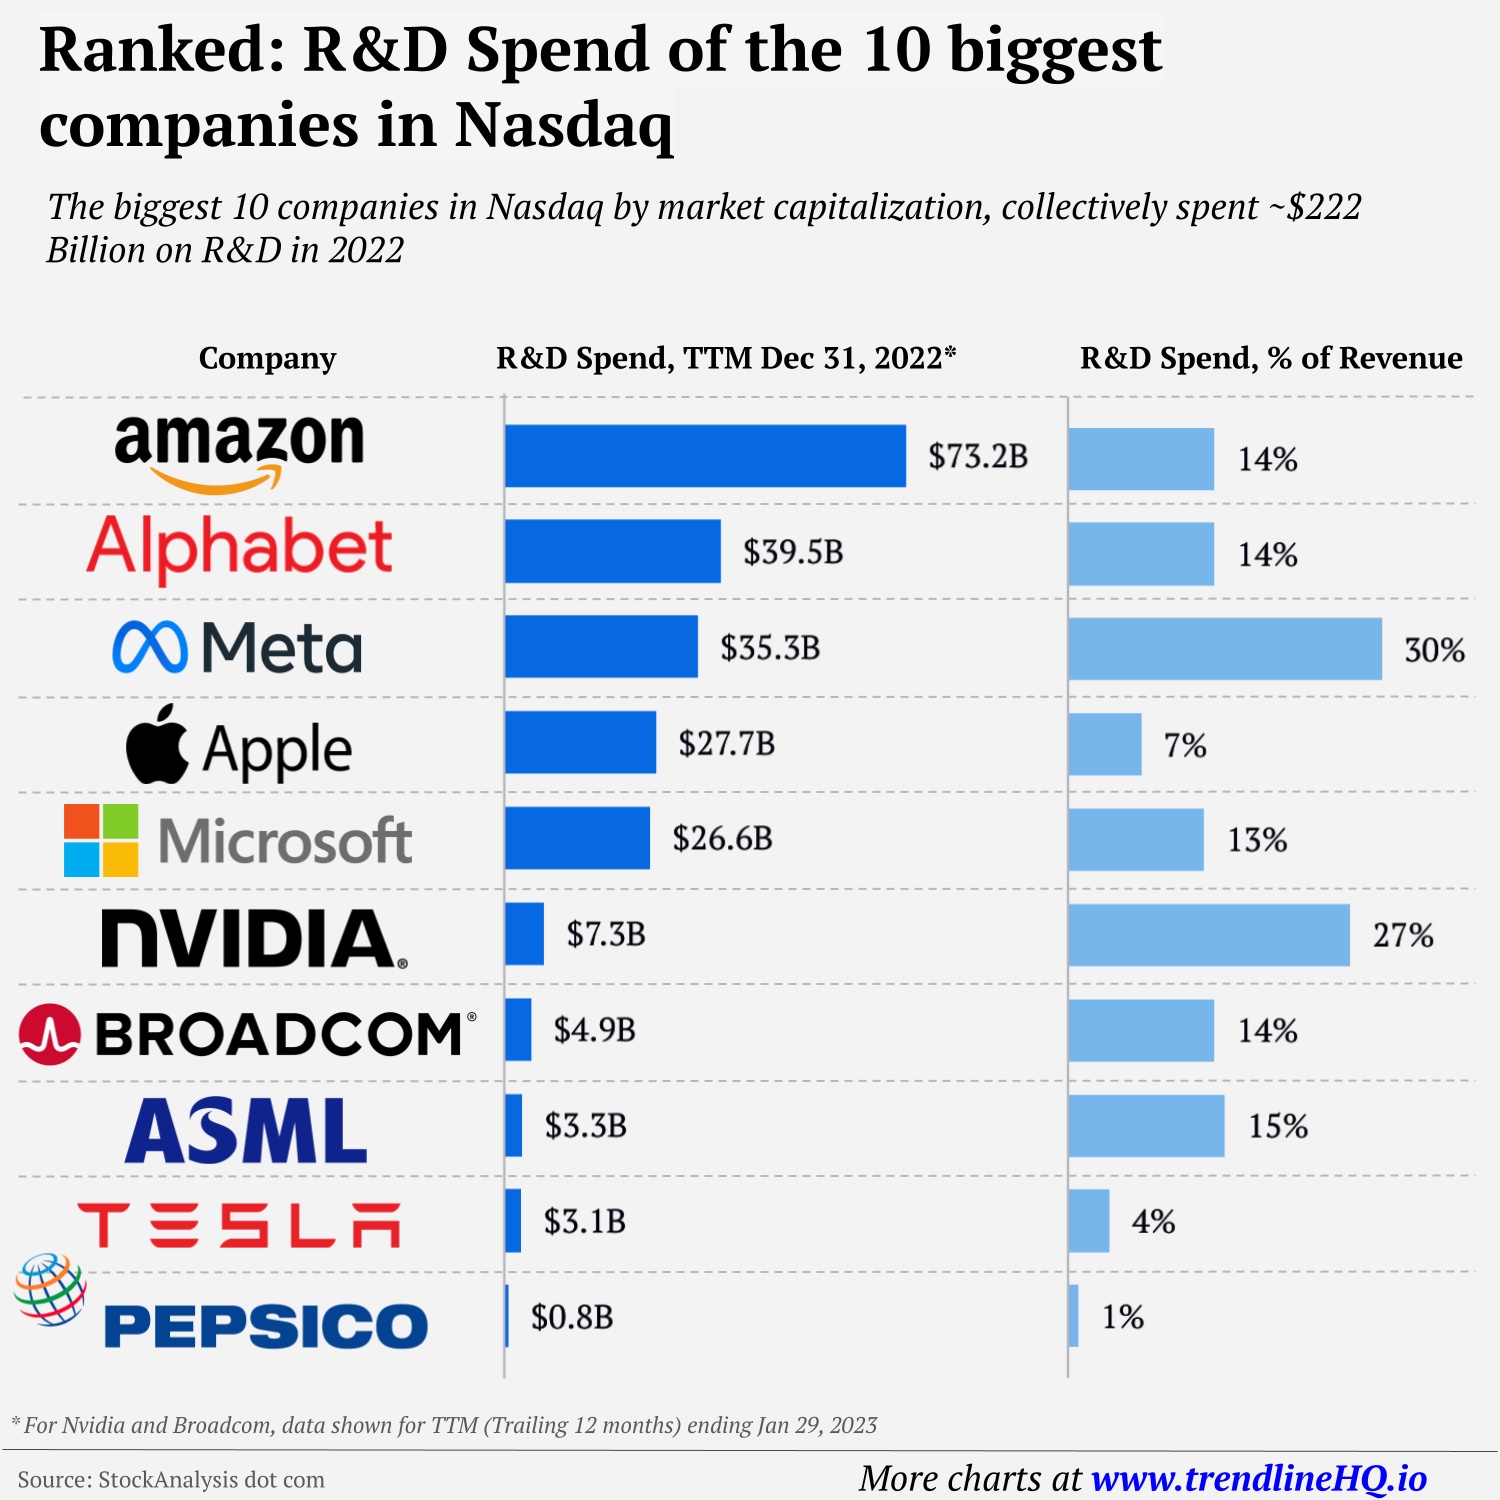
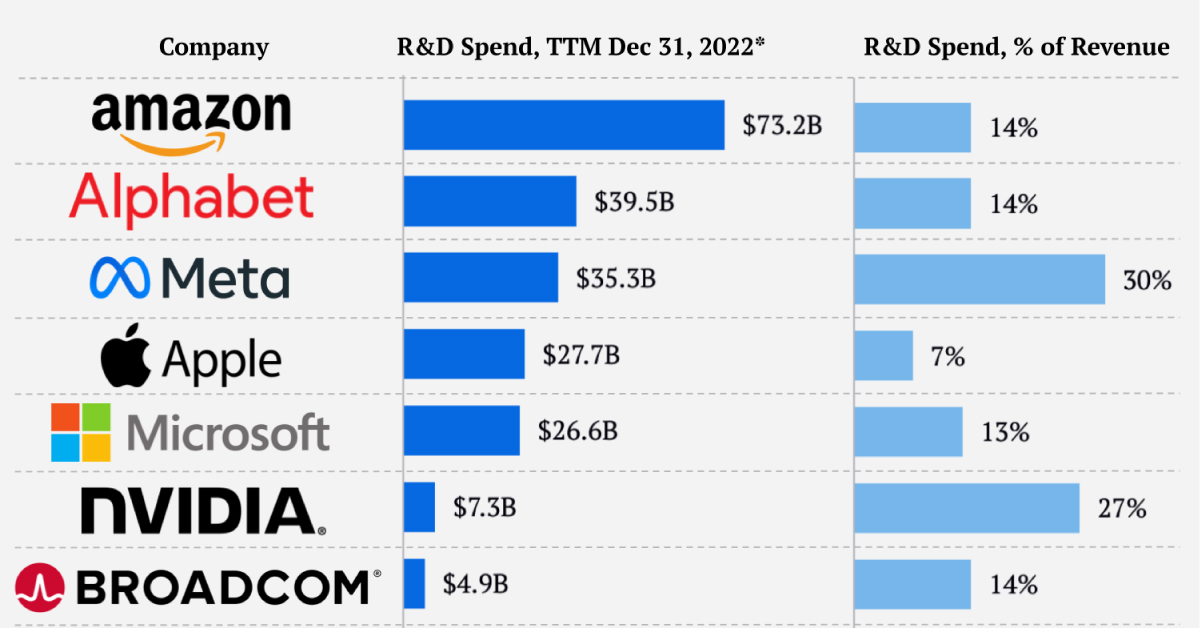
In 2022, the 10 largest Nasdaq companies by market cap spent roughly $222 billion on R&D—a figure that has risen considerably in recent years.
| Rank | Name | R&D % of Revenue | R&D Spend in 2022* (Billions) |
|---|---|---|---|
| 1 | Amazon | 14% | $73.2 |
| 2 | Alphabet | 14% | $39.5 |
| 3 | Meta | 30% | $35.3 |
| 4 | Apple | 7% | $27.7 |
| 5 | Microsoft | 13% | $26.6 |
| 6 | Nvidia | 27% | $7.3 |
| 7 | Broadcom | 14% | $4.9 |
| 8 | ASML | 15% | $3.3 |
| 9 | Tesla | 4% | $3.1 |
| 10 | PepsiCo | 1% | $0.8 |
*Trailing 12 months, ending December 31, 2022. Nvidia and Broadcom data is as of January 29, 2023.
Amazon invested over $73 billion in R&D last year, more than double the levels seen at Meta or Apple. R&D spending increased 30% over the year for the retail heavyweight, as it invested in technology infrastructure that underlies everything from software to autonomous vehicles.
Facebook parent Meta spent almost a third of its annual revenues on R&D in 2022, the highest proportion across the 10 largest Nasdaq companies. The majority of these investments were through its research arm, Reality Labs, which is focused on building a metaverse. However, the company has since pivoted away from its work on the metaverse due to a lackluster response—instead focusing on generative AI.
Chipmaker Nvidia, which has seen its market capitalization skyrocket in 2023, spent over $7 billion on R&D across generative AI, deep learning, robotics, and a number of other research areas. Between 2021 and 2022, investments in R&D grew by 34%.
Fastest Rising R&D Spenders, Globally
Beyond big tech names in the Nasdaq, many companies are accelerating their investment in R&D as the complexity of technology increases.
The table below shows the top 10 companies globally with the highest increase in R&D spend, based on analysis by fDi Intelligence.
| Rank | Name | Country | R&D Spending % Change 2021-2022 |
|---|---|---|---|
| 1 | BYD | 🇨🇳 China | +133% |
| 2 | AMD | 🇺🇸 U.S. | +76% |
| 3 | Moderna | 🇺🇸 U.S. | +65% |
| 4 | Meta | 🇺🇸 U.S. | +43% |
| 5 | Nvidia | 🇺🇸 U.S. | +39% |
| 6 | Uber | 🇺🇸 U.S. | +36% |
| 7 | Novo Nordisk | 🇩🇰 Denmark | +35% |
| 8 | Vertex Pharmaceuticals | 🇺🇸 U.S. | +31% |
| 9 | TSMC | 🇨🇳 Taiwan | +31% |
| 10 | Amazon | 🇺🇸 U.S. | +31% |
China’s largest electric vehicle maker, BYD, increased R&D investment by 133%, the most across companies analyzed. Among its primary research areas is the “Blade Battery”, which is a prismatic battery designed to hold as much as 50% more energy than comparable models.
Two chipmakers, AMD and TSMC also made the list, while three healthcare companies Moderna, Novo Nordisk, and Vertex Pharmaceuticals made significant R&D investments.
The Future of Innovation Spending
Even as many big tech names saw their stock prices fall in 2022, many dramatically increased their R&D investment.
This came as tech firms laid off thousands of employees. Together, Amazon, Microsoft, and Google’s parent company Alphabet laid of 40,000 employees as of early 2023.
Despite challenging environments, the focus on R&D is evident. Large companies can apply innovation across numerous areas of their business, improve efficiencies, with the goal of making the most out of research dollars spent.
At the same time, the complexity of technology is accelerating, requiring companies to spend more to keep with the pace of innovation. This involves investment in engineers, research facilities, along with the cost of running more advanced technological infrastructure.
Between 2000 and 2020, global R&D spending increased more than threefold to $2.4 trillion, a trend that shows minimal signs of slowing.

This article was published as a part of Visual Capitalist's Creator Program, which features data-driven visuals from some of our favorite Creators around the world.


Technology
All of the Grants Given by the U.S. CHIPS Act
Intel, TSMC, and more have received billions in subsidies from the U.S. CHIPS Act in 2024.


All of the Grants Given by the U.S. CHIPS Act
This was originally posted on our Voronoi app. Download the app for free on iOS or Android and discover incredible data-driven charts from a variety of trusted sources.
This visualization shows which companies are receiving grants from the U.S. CHIPS Act, as of April 25, 2024. The CHIPS Act is a federal statute signed into law by President Joe Biden that authorizes $280 billion in new funding to boost domestic research and manufacturing of semiconductors.
The grant amounts visualized in this graphic are intended to accelerate the production of semiconductor fabrication plants (fabs) across the United States.
Data and Company Highlights
The figures we used to create this graphic were collected from a variety of public news sources. The Semiconductor Industry Association (SIA) also maintains a tracker for CHIPS Act recipients, though at the time of writing it does not have the latest details for Micron.
| Company | Federal Grant Amount | Anticipated Investment From Company |
|---|---|---|
| 🇺🇸 Intel | $8,500,000,000 | $100,000,000,000 |
| 🇹🇼 TSMC | $6,600,000,000 | $65,000,000,000 |
| 🇰🇷 Samsung | $6,400,000,000 | $45,000,000,000 |
| 🇺🇸 Micron | $6,100,000,000 | $50,000,000,000 |
| 🇺🇸 GlobalFoundries | $1,500,000,000 | $12,000,000,000 |
| 🇺🇸 Microchip | $162,000,000 | N/A |
| 🇬🇧 BAE Systems | $35,000,000 | N/A |
BAE Systems was not included in the graphic due to size limitations
Intel’s Massive Plans
Intel is receiving the largest share of the pie, with $8.5 billion in grants (plus an additional $11 billion in government loans). This grant accounts for 22% of the CHIPS Act’s total subsidies for chip production.
From Intel’s side, the company is expected to invest $100 billion to construct new fabs in Arizona and Ohio, while modernizing and/or expanding existing fabs in Oregon and New Mexico. Intel could also claim another $25 billion in credits through the U.S. Treasury Department’s Investment Tax Credit.
TSMC Expands its U.S. Presence
TSMC, the world’s largest semiconductor foundry company, is receiving a hefty $6.6 billion to construct a new chip plant with three fabs in Arizona. The Taiwanese chipmaker is expected to invest $65 billion into the project.
The plant’s first fab will be up and running in the first half of 2025, leveraging 4 nm (nanometer) technology. According to TrendForce, the other fabs will produce chips on more advanced 3 nm and 2 nm processes.
The Latest Grant Goes to Micron
Micron, the only U.S.-based manufacturer of memory chips, is set to receive $6.1 billion in grants to support its plans of investing $50 billion through 2030. This investment will be used to construct new fabs in Idaho and New York.

-

 Sports1 week ago
The Highest Earning Athletes in Seven Professional Sports
-

 Countries2 weeks ago
Population Projections: The World’s 6 Largest Countries in 2075
-

 Markets2 weeks ago
The Top 10 States by Real GDP Growth in 2023
-

 Demographics2 weeks ago
The Smallest Gender Wage Gaps in OECD Countries
-

 United States2 weeks ago
Where U.S. Inflation Hit the Hardest in March 2024
-

 Green2 weeks ago
Top Countries By Forest Growth Since 2001
-

 United States2 weeks ago
Ranked: The Largest U.S. Corporations by Number of Employees
-

 Maps2 weeks ago
The Largest Earthquakes in the New York Area (1970-2024)