Markets
How Big Tech Revenue and Profit Breaks Down, by Company
Article/Editing:
In the media and public discourse, companies like Alphabet, Apple, and Microsoft are often lumped together into the same “Big Tech” category. After all, they constitute the world’s largest companies by market capitalization.
And because of this, it’s easy to assume they’re in direct competition with each other, fiercely battling for a bigger piece of the “Big Tech” pie. But while there is certainly competition between the world’s tech giants, it’s a lot less drastic than you might imagine.
This is apparent when you look into their various revenue streams, and this series of graphics by Truman Du provides a revenue breakdown of Alphabet, Amazon, Apple, and Microsoft.
How Big Tech Companies Generate Revenue
So how does each big tech firm make money? Let’s explore using data from each company’s June 2022 quarterly income statements.
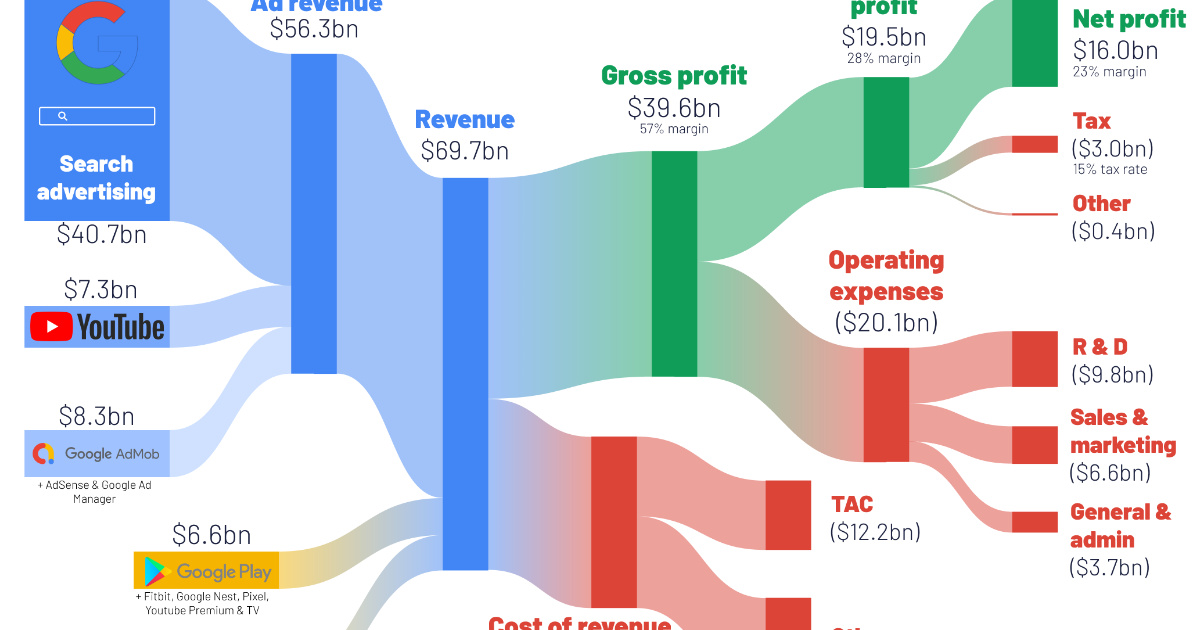
Alphabet

View the full-size infographic
In Q2 2022, about 72% of Alphabet’s revenue came from search advertising. This makes sense considering Google and YouTube get a lot of eyeballs. Google dominates the search market—about 90% of all internet searches are done on Google platforms.
Amazon
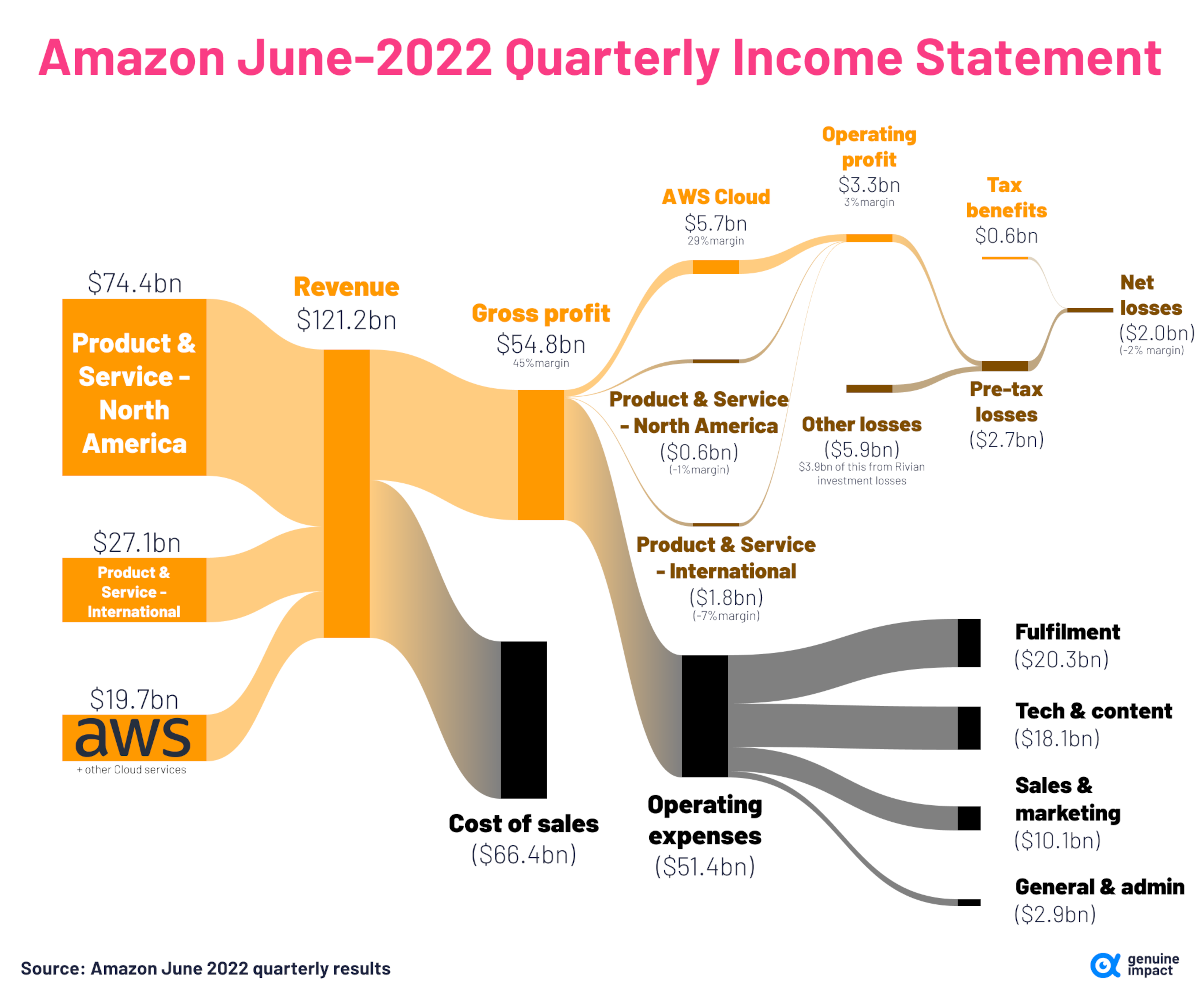
View the full-size infographic
Perhaps unsurprisingly, Amazon’s biggest revenue driver is e-commerce. However, as the graphic above shows, the costs of e-commerce are so steep, that it actually reported a net loss in Q2 2022.
As it often is, Amazon Web Services (AWS) was the company’s main profit-earner this quarter.
Apple
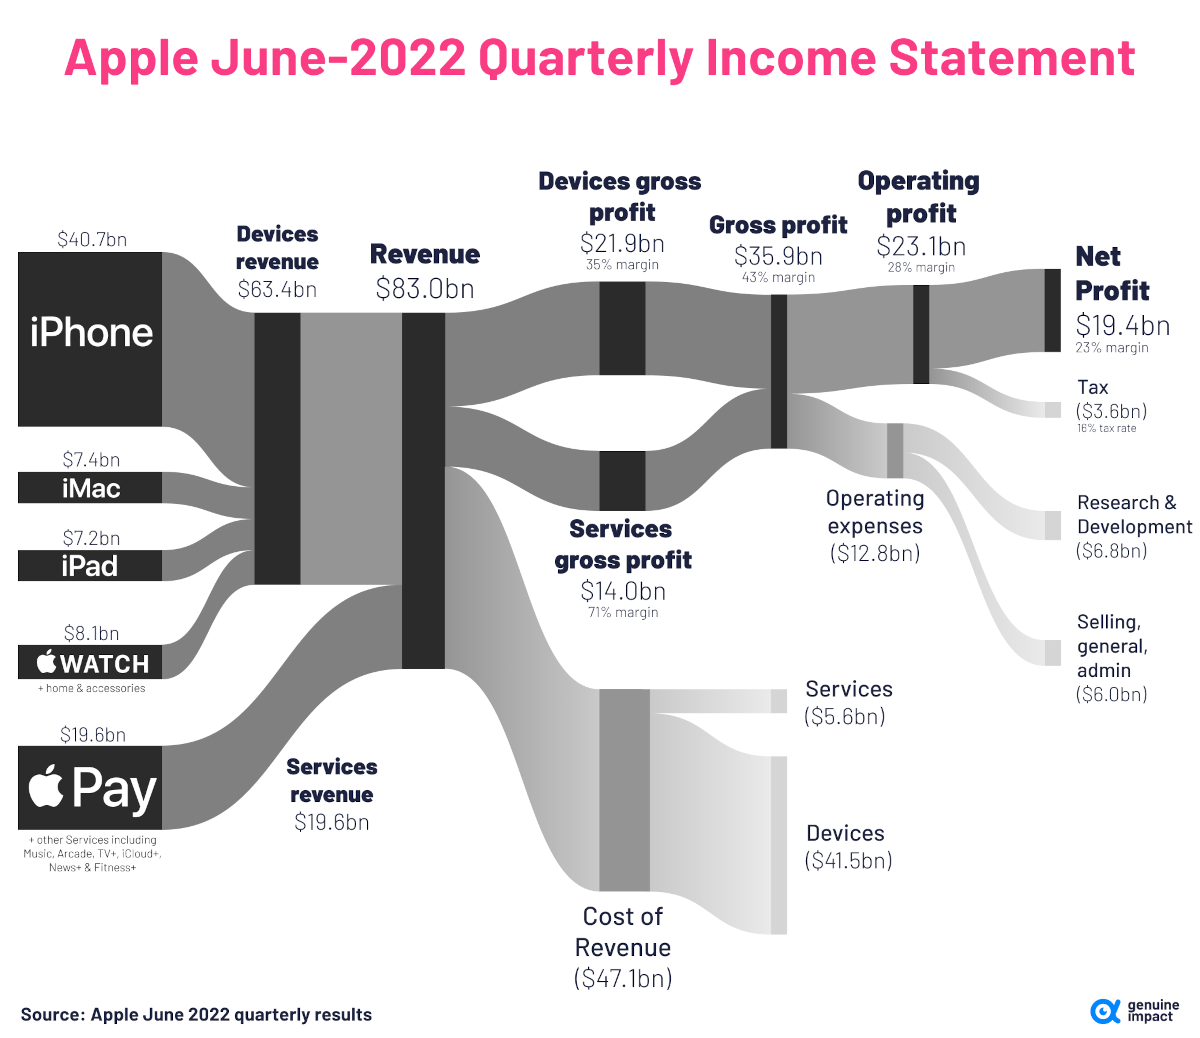
View the full-size infographic
Apple’s biggest revenue driver is consumer electronics sales, particularly from the iPhone which accounts for nearly half of overall revenue. iPhones are particularly popular in the U.S., where they make up around 50% of smartphone sales across the country.
Besides devices, services like Apple Music, Apple Pay, and Apple TV+ also generate revenue for the company. But in Q2 2022, Apple’s services branch accounted for only 24% of the company’s overall revenue.
Microsoft
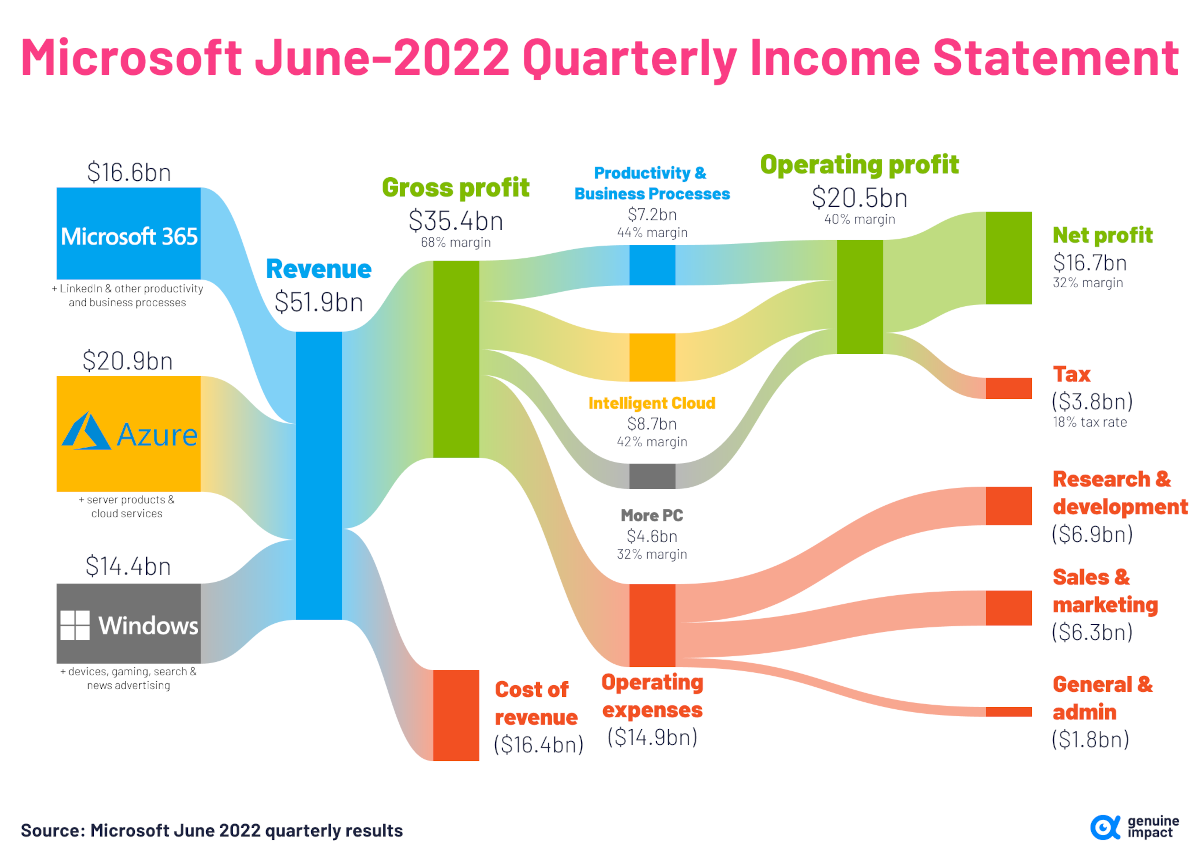
View the full-size infographic
Microsoft has a fairly even split between its various revenue sources, but similarly to Amazon its biggest revenue driver is its cloud services platform, Azure.
After AWS, Azure is the second largest cloud server in the world, capturing 21% of the global cloud infrastructure market.

This article was published as a part of Visual Capitalist's Creator Program, which features data-driven visuals from some of our favorite Creators around the world.


Maps
Mapped: The 10 U.S. States With the Lowest Real GDP Growth
In this graphic, we show where real GDP lagged the most across America in 2023 as high interest rates weighed on state economies.


The Top 10 U.S. States, by Lowest Real GDP Growth
This was originally posted on our Voronoi app. Download the app for free on iOS or Android and discover incredible data-driven charts from a variety of trusted sources.
While the U.S. economy defied expectations in 2023, posting 2.5% in real GDP growth, several states lagged behind.
Last year, oil-producing states led the pack in terms of real GDP growth across America, while the lowest growth was seen in states that were more sensitive to the impact of high interest rates, particularly due to slowdowns in the manufacturing and finance sectors.
This graphic shows the 10 states with the least robust real GDP growth in 2023, based on data from the Bureau of Economic Analysis.
Weakest State Economies in 2023
Below, we show the states with the slowest economic activity in inflation-adjusted terms, using chained 2017 dollars:
| Rank | State | Real GDP Growth 2023 YoY | Real GDP 2023 |
|---|---|---|---|
| 1 | Delaware | -1.2% | $74B |
| 2 | Wisconsin | +0.2% | $337B |
| 3 | New York | +0.7% | $1.8T |
| 4 | Missississippi | +0.7% | $115B |
| 5 | Georgia | +0.8% | $661B |
| 6 | Minnesota | +1.2% | $384B |
| 7 | New Hampshire | +1.2% | $91B |
| 8 | Ohio | +1.2% | $698B |
| 9 | Iowa | +1.3% | $200B |
| 10 | Illinois | +1.3% | $876B |
| U.S. | +2.5% | $22.4T |
Delaware witnessed the slowest growth in the country, with real GDP growth of -1.2% over the year as a sluggish finance and insurance sector dampened the state’s economy.
Like Delaware, the Midwestern state of Wisconsin also experienced declines across the finance and insurance sector, in addition to steep drops in the agriculture and manufacturing industries.
America’s third-biggest economy, New York, grew just 0.7% in 2023, falling far below the U.S. average. High interest rates took a toll on key sectors, with notable slowdowns in the construction and manufacturing sectors. In addition, falling home prices and a weaker job market contributed to slower economic growth.
Meanwhile, Georgia experienced the fifth-lowest real GDP growth rate. In March 2024, Rivian paused plans to build a $5 billion EV factory in Georgia, which was set to be one of the biggest economic development initiatives in the state in history.
These delays are likely to exacerbate setbacks for the state, however, both Kia and Hyundai have made significant investments in the EV industry, which could help boost Georgia’s manufacturing sector looking ahead.

-

 Personal Finance1 week ago
Visualizing the Tax Burden of Every U.S. State
-

 Misc6 days ago
Visualized: Aircraft Carriers by Country
-

 Culture7 days ago
How Popular Snack Brand Logos Have Changed
-

 Mining1 week ago
Visualizing Copper Production by Country in 2023
-

 Misc1 week ago
Charted: How Americans Feel About Federal Government Agencies
-

 Healthcare1 week ago
Which Countries Have the Highest Infant Mortality Rates?
-

 Demographics1 week ago
Mapped: U.S. Immigrants by Region
-

 Maps1 week ago
Mapped: Southeast Asia’s GDP Per Capita, by Country