Markets
The Monthly Cost of Buying vs. Renting a House in America
The Monthly Cost of Buying vs. Renting a House in America
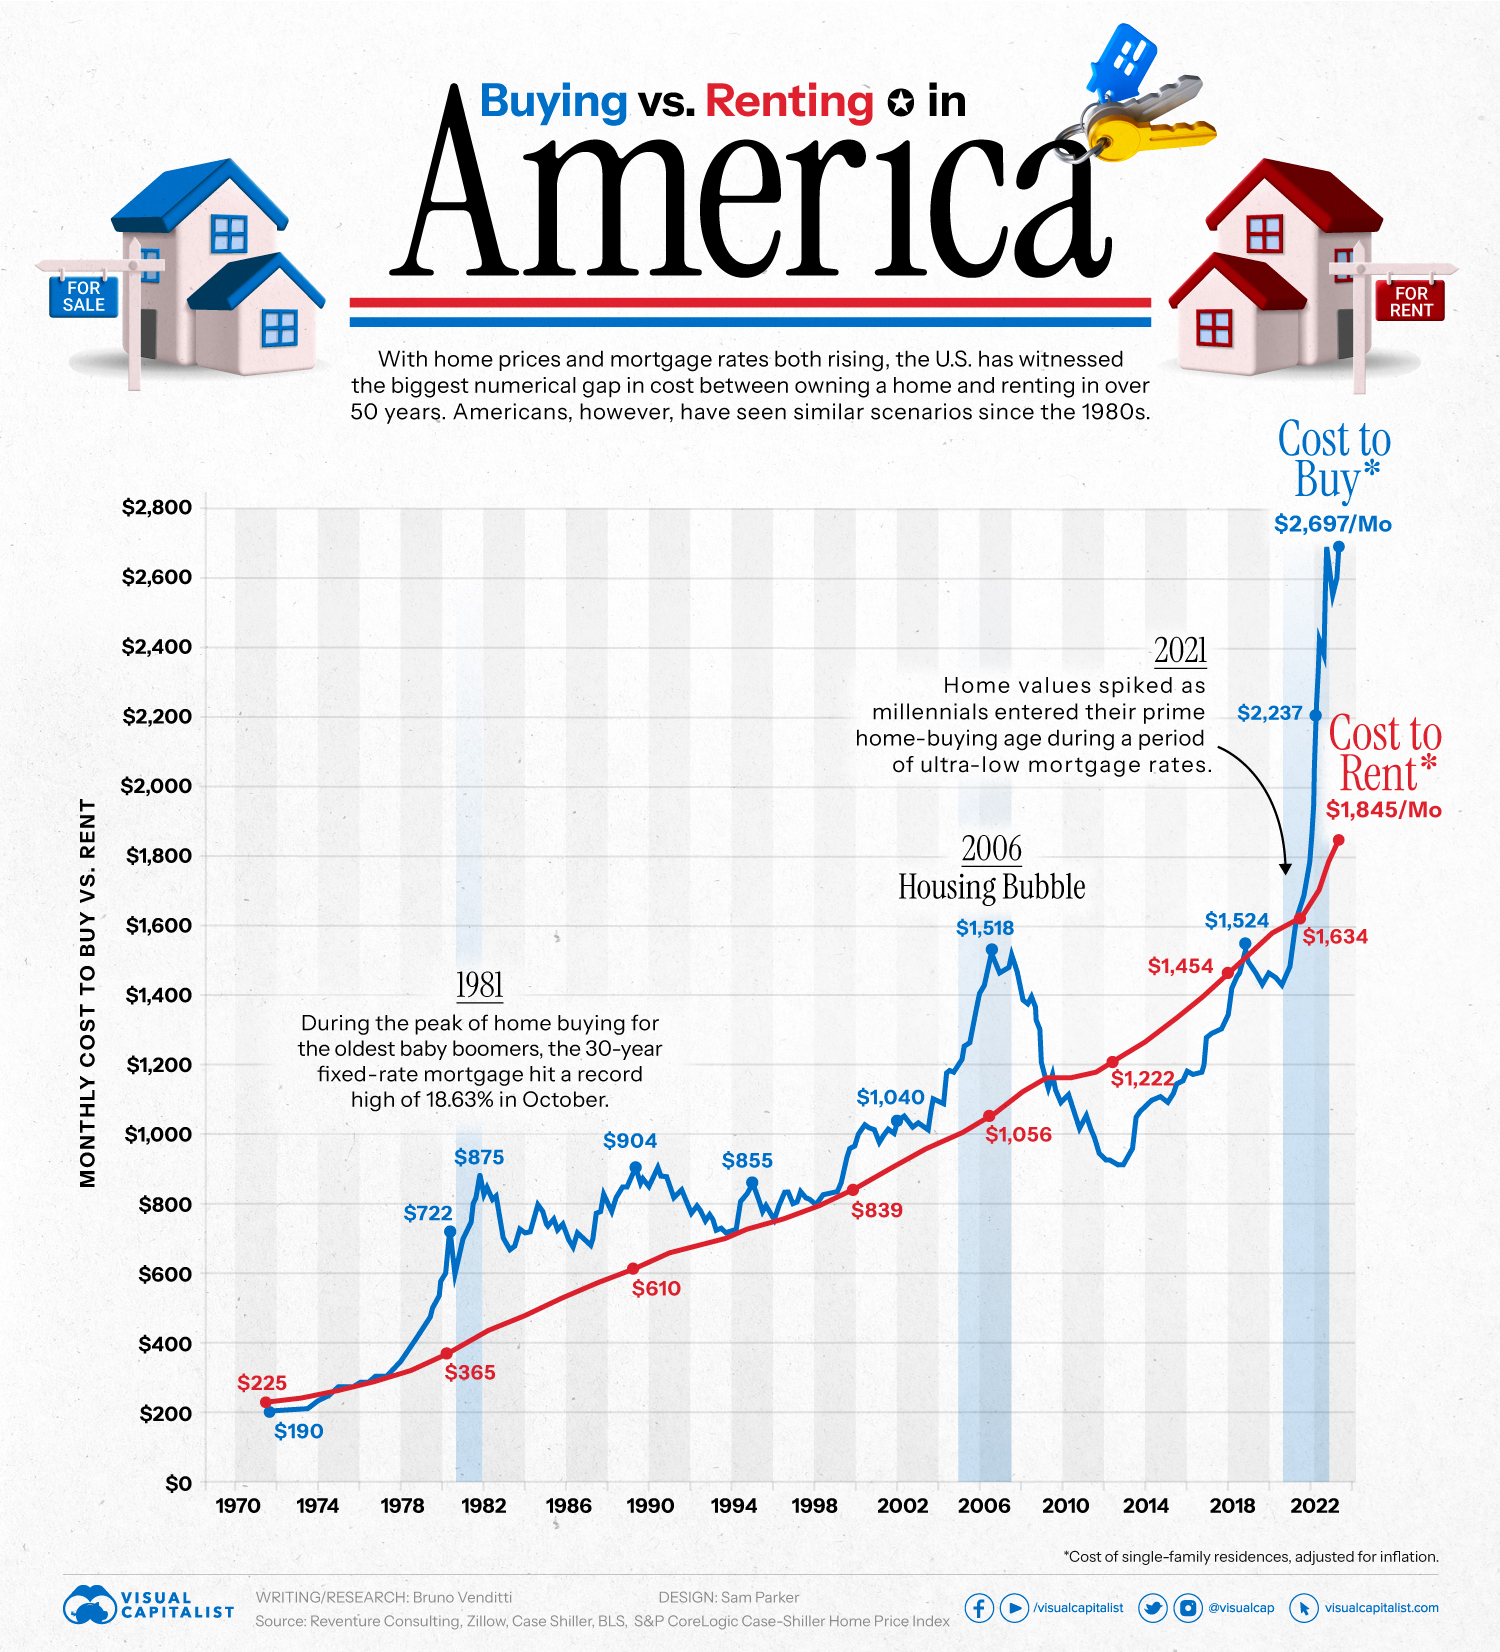
With home prices and mortgage rates both rising, the U.S. is now witnessing the biggest numerical gap in the monthly cost between owning a home and renting in over 50 years.
Americans, however, have seen similar scenarios occur since the early 1980s.
Today’s chart uses data from Reventure Consulting to highlight the cost of buying vs. renting a single-family residence in the U.S. since 1970, adjusted for inflation.
Mortgage Rates Jump to New High
In August 2023, mortgage rates rose to the highest level in 23 years, with the national average 30-year fixed mortgage hitting 7.48%.
As a result, the median rent in America is approximately $1,850 per month, about 30% cheaper than the median cost to buy, standing at $2,700 per month. This gap represents the largest difference between renting and buying in U.S. history.
While the difference was less than $200 in 2022, in 2023 the gap surpassed $800.
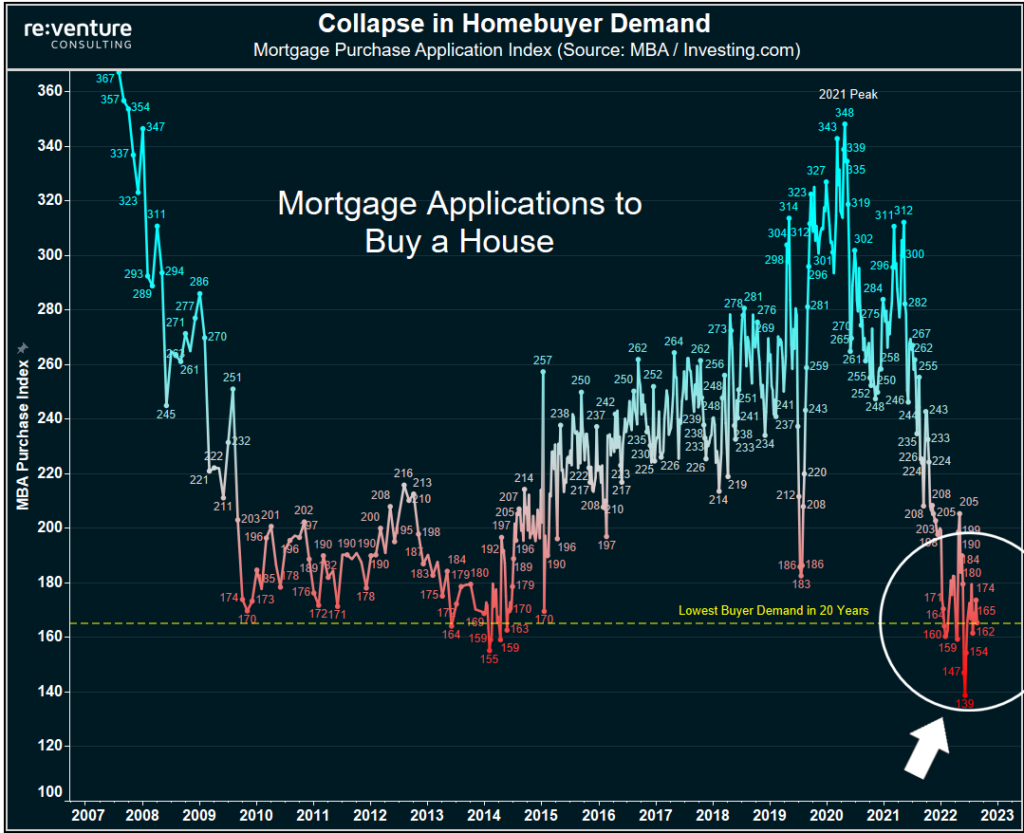
Many buyers, particularly those seeking their initial home purchase, have now been priced out of the market with concerns that they cannot afford home ownership. As a result, mortgage applications for home purchases have hit their lowest point in 20 years:
Rent costs have also seen an uptick, but not at the same pace, as the market adjusted following a steep rent spike witnessed during the pandemic.
Will Mortgage Rates Drop in 2023?
Increases in interest rates affect long-term home loans, such as 30-year fixed-rate mortgages. And starting in 2022, the Federal Reserve began to hike rates from their near-zero level to the current range of 5.25-5.5%.
Recently, the Federal Reserve unveiled new projections, indicating that the interest rate could potentially reach 5.6% by the end of 2023, implying at least one more rate hike in 2023.
As a result, numerous experts are anticipating that mortgage rates will likely remain above 6% for the rest of this year.


Markets
Mapped: Europe’s GDP Per Capita, by Country
Which European economies are richest on a GDP per capita basis? This map shows the results for 44 countries across the continent.


Mapped: Europe’s GDP Per Capita, by Country (2024)
This was originally posted on our Voronoi app. Download the app for free on iOS or Android and discover incredible data-driven charts from a variety of trusted sources.
Europe is home to some of the largest and most sophisticated economies in the world. But how do countries in the region compare with each other on a per capita productivity basis?
In this map, we show Europe’s GDP per capita levels across 44 nations in current U.S. dollars. Data for this visualization and article is sourced from the International Monetary Fund (IMF) via their DataMapper tool, updated April 2024.
Europe’s Richest and Poorest Nations, By GDP Per Capita
Luxembourg, Ireland, and Switzerland, lead the list of Europe’s richest nations by GDP per capita, all above $100,000.
| Rank | Country | GDP Per Capita (2024) |
|---|---|---|
| 1 | 🇱🇺 Luxembourg | $131,380 |
| 2 | 🇮🇪 Ireland | $106,060 |
| 3 | 🇨🇭 Switzerland | $105,670 |
| 4 | 🇳🇴 Norway | $94,660 |
| 5 | 🇮🇸 Iceland | $84,590 |
| 6 | 🇩🇰 Denmark | $68,900 |
| 7 | 🇳🇱 Netherlands | $63,750 |
| 8 | 🇸🇲 San Marino | $59,410 |
| 9 | 🇦🇹 Austria | $59,230 |
| 10 | 🇸🇪 Sweden | $58,530 |
| 11 | 🇧🇪 Belgium | $55,540 |
| 12 | 🇫🇮 Finland | $55,130 |
| 13 | 🇩🇪 Germany | $54,290 |
| 14 | 🇬🇧 UK | $51,070 |
| 15 | 🇫🇷 France | $47,360 |
| 16 | 🇦🇩 Andorra | $44,900 |
| 17 | 🇲🇹 Malta | $41,740 |
| 18 | 🇮🇹 Italy | $39,580 |
| 19 | 🇨🇾 Cyprus | $37,150 |
| 20 | 🇪🇸 Spain | $34,050 |
| 21 | 🇸🇮 Slovenia | $34,030 |
| 22 | 🇪🇪 Estonia | $31,850 |
| 23 | 🇨🇿 Czech Republic | $29,800 |
| 24 | 🇵🇹 Portugal | $28,970 |
| 25 | 🇱🇹 Lithuania | $28,410 |
| 26 | 🇸🇰 Slovakia | $25,930 |
| 27 | 🇱🇻 Latvia | $24,190 |
| 28 | 🇬🇷 Greece | $23,970 |
| 29 | 🇭🇺 Hungary | $23,320 |
| 30 | 🇵🇱 Poland | $23,010 |
| 31 | 🇭🇷 Croatia | $22,970 |
| 32 | 🇷🇴 Romania | $19,530 |
| 33 | 🇧🇬 Bulgaria | $16,940 |
| 34 | 🇷🇺 Russia | $14,390 |
| 35 | 🇹🇷 Türkiye | $12,760 |
| 36 | 🇲🇪 Montenegro | $12,650 |
| 37 | 🇷🇸 Serbia | $12,380 |
| 38 | 🇦🇱 Albania | $8,920 |
| 39 | 🇧🇦 Bosnia & Herzegovina | $8,420 |
| 40 | 🇲🇰 North Macedonia | $7,690 |
| 41 | 🇧🇾 Belarus | $7,560 |
| 42 | 🇲🇩 Moldova | $7,490 |
| 43 | 🇽🇰 Kosovo | $6,390 |
| 44 | 🇺🇦 Ukraine | $5,660 |
| N/A | 🇪🇺 EU Average | $44,200 |
Note: Figures are rounded.
Three Nordic countries (Norway, Iceland, Denmark) also place highly, between $70,000-90,000. Other Nordic peers, Sweden and Finland rank just outside the top 10, between $55,000-60,000.
Meanwhile, Europe’s biggest economies in absolute terms, Germany, UK, and France, rank closer to the middle of the top 20, with GDP per capitas around $50,000.
Finally, at the end of the scale, Eastern Europe as a whole tends to have much lower per capita GDPs. In that group, Ukraine ranks last, at $5,660.
A Closer Look at Ukraine
For a broader comparison, Ukraine’s per capita GDP is similar to Iran ($5,310), El Salvador ($5,540), and Guatemala ($5,680).
According to experts, Ukraine’s economy has historically underperformed to expectations. After the fall of the Berlin Wall, the economy contracted for five straight years. Its transition to a Western, liberalized economic structure was overshadowed by widespread corruption, a limited taxpool, and few revenue sources.
Politically, its transformation from authoritarian regime to civil democracy has proved difficult, especially when it comes to institution building.
Finally, after the 2022 invasion of the country, Ukraine’s GDP contracted by 30% in a single year—the largest loss since independence. Large scale emigration—to the tune of six million refugees—is also playing a role.
Despite these challenges, the country’s economic growth has somewhat stabilized while fighting continues.

-

 Technology6 days ago
Countries With the Highest Rates of Crypto Ownership
-

 Mining2 weeks ago
Visualizing Global Gold Production in 2023
-

 Markets2 weeks ago
Visualized: Interest Rate Forecasts for Advanced Economies
-

 Economy2 weeks ago
The Most Valuable Companies in Major EU Economies
-

 Markets2 weeks ago
The World’s Fastest Growing Emerging Markets (2024-2029 Forecast)
-

 Markets1 week ago
Visualizing Global Inflation Forecasts (2024-2026)
-

 Misc1 week ago
Charted: What Southeast Asia Thinks About China & the U.S.
-

 Misc1 week ago
The Evolution of U.S. Beer Logos