Technology
Infographic: A Timeline of Future Technology
A Timeline of Future Technology
Making predictions about future technology is both fun and notoriously difficult.
However, such predictions also serve a very practical purpose for investors and business leaders, since failing to adapt to changing industry paradigms can completely decimate a business venture, turning it into the next Blockbuster, Kodak, or Sears.
Today’s infographic from Futurism rounds up some of the most interesting predictions about the future, from trusted sources such as Scientific American and The National Academy of Sciences.
Machines, Big and Small
The confluence of robotics, artificial intelligence, and increasing levels of automation is a prevailing trend throughout the projected timeline of future technology.
In less than 10 years, we will be able to control machines based on eye movements, while ingesting nano-sized robots to repair injuries from within our bodies. Later on, it’s also expected that the next wave of AI will be a reality: by 2036, predictive AI will be able to predict the near-future with impressive precision. Elections, weather, geopolitical events, and other dynamic systems will be analyzed in real-time using thousands or millions of data streams.
Even further down the line, human brains and machines will be continue to become closer to interfacing directly, creating all kinds of possibilities.
The Energy Revolution Continues
If you think the current progress in clean energy is exciting – wait until you see the technologies in the queue.
The future of battery technology will include carbon-breathing batteries that turn CO2 into generate electricity, as well as diamond-based “nuclear batteries” that run off of nuclear waste.
Meanwhile, solar power will be even cheaper as cells operate at near 100% efficiency, and commercial fusion power will be available by 2044. Climate change will also be tackled by interesting techniques, such as geoengineering with calcite aerosols, and carbon sequestration.
More on Future Technology
Want to see more bold predictions about the future of technology?
Check out the future of alternative energy, the military, or the futuristic tech that could be inside your home.
Lastly, check out some very speculative predictions about what the world could look like, 100 years from now.


Technology
Ranked: The Top Startup Cities Around the World
Here are the global startup ecosystem rankings, highlighting the scale and maturity of major tech hubs worldwide.
The Top Startup Cities Around the World
This was originally posted on our Voronoi app. Download the app for free on iOS or Android and discover incredible data-driven charts from a variety of trusted sources.
A richly connected network of founders, venture capital firms, and tech talent are some of the key ingredients driving a startup ecosystem.
As engines of growth, these tech clusters are evolving on a global scale. While the world’s leading startup cities are concentrated in America, several ecosystems, such as Beijing and Seoul, are growing in prominence as countries focus on technological advancement to spur innovation.
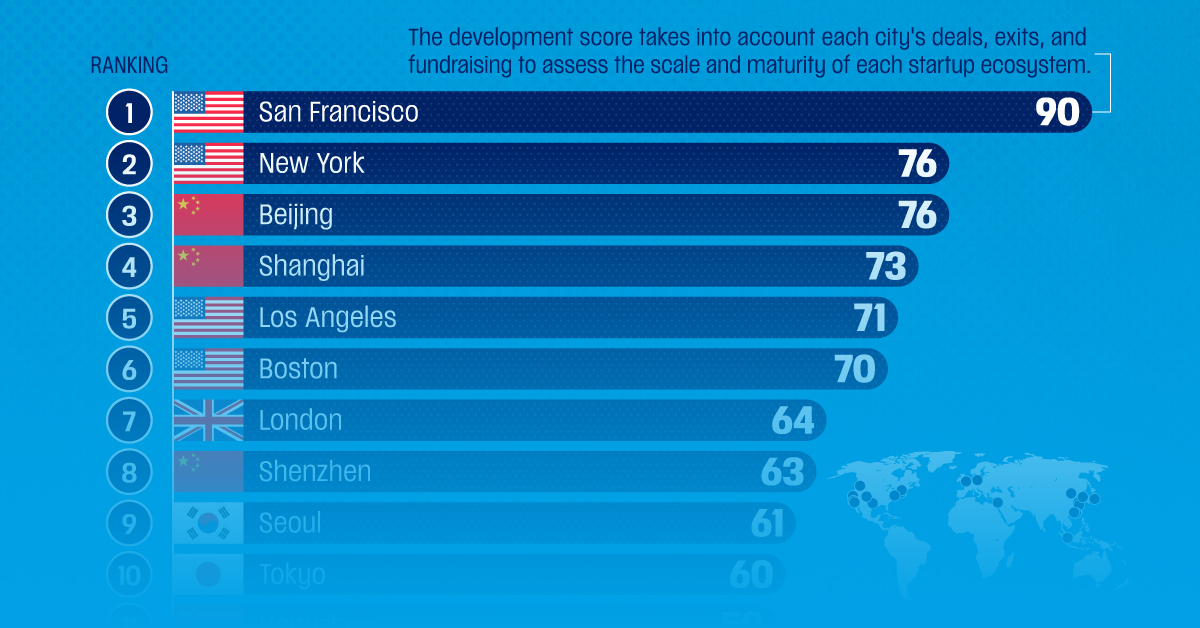
This graphic shows the best startup cities worldwide, based on data from Pitchbook.
The Global Startup Ecosystem Rankings
To determine the rankings, each city was analyzed based on the scale and maturity of their startup ecosystem over a six-year period ending in the second quarter of 2023.
Among the inputs analyzed and used to calculate the overall development score were fundraising activity, venture capital deals, and exit value:
| Rank | City | Development Score | Capital Raised | Deal Count | Exit Value |
|---|---|---|---|---|---|
| 1 | 🇺🇸 San Francisco | 90 | $427.6B | 19,898 | $766.3B |
| 2 | 🇺🇸 New York | 76 | $179.9B | 13,594 | $171.7B |
| 3 | 🇨🇳 Beijing | 76 | $161.2B | 8,835 | $279.2B |
| 4 | 🇨🇳 Shanghai | 73 | $130.3B | 7,422 | $186.8B |
| 5 | 🇺🇸 Los Angeles | 71 | $144.6B | 9,781 | $181.4B |
| 6 | 🇺🇸 Boston | 70 | $117.0B | 6,044 | $172.8B |
| 7 | 🇬🇧 London | 64 | $99.0B | 11,533 | $71.9B |
| 8 | 🇨🇳 Shenzhen | 63 | $46.4B | 5,020 | $66.3B |
| 9 | 🇰🇷 Seoul | 61 | $31.1B | 6,196 | $71.0B |
| 10 | 🇯🇵 Tokyo | 60 | $26.2B | 5,590 | $28.0B |
| 11 | 🇨🇳 Hangzhou | 59 | $50.7B | 3,361 | $88.7B |
| 12 | 🇺🇸 Washington D.C. | 55 | $43.7B | 2,706 | $28.2B |
| 13 | 🇺🇸 Seattle | 54 | $31.7B | 2,693 | $35.6B |
| 14 | 🇸🇬 Singapore | 52 | $45.7B | 4,507 | $38.0B |
| 15 | 🇺🇸 San Diego | 52 | $33.5B | 2,023 | $44.7B |
| 16 | 🇺🇸 Austin | 52 | $26.4B | 2,636 | $22.9B |
| 17 | 🇨🇳 Guangzhou | 52 | $24.7B | 1,700 | $24.0B |
| 18 | 🇮🇱 Tel Aviv | 51 | $21.0B | 1,936 | $32.2B |
| 19 | 🇺🇸 Denver | 51 | $26.8B | 2,489 | $29.9B |
| 20 | 🇩🇪 Berlin | 50 | $31.2B | 2,469 | $15.9B |
San Francisco dominates the pack, with $427.6 billion in capital raised over the six-year period.
Despite a challenging funding environment, nearly 20,000 deals closed, highlighting its outsized role in launching tech startups. Both OpenAI and rival Anthropic are headquartered in the city, thanks to its broad pool of tech talent and venture capital firms. Overall, 11,812 startups were based in the San Francisco Bay Area in 2023, equal to about 20% of startups in America.
Falling next in line is New York City, which raised $179.9 billion over the same time period. Crypto firm Gemini and machine learning company, Hugging Face, are two examples of startups based in the city.
As the top-ranking hub outside of America, Beijing is home to TikTok’s parent company, ByteDance, which is one of the most valuable private companies in the world.
In recent years, much of the startup funding in China is being driven by government-backed funds. In particular, these funds are focusing heavily on “hard tech” such as semiconductor-makers and electric vehicle companies that align with the government’s strategic long-term goals.
Another leading tech hub, Singapore, has the highest venture capital funding per capita worldwide. In 2023, this was equal to an impressive $1,060 in venture funding per person. By comparison, venture funding was $345 per person in the U.S., the second-highest globally.

-

 Healthcare2 weeks ago
Which Countries Have the Highest Infant Mortality Rates?
-

 Misc1 week ago
Visualizing Global Losses from Financial Scams
-

 population1 week ago
Mapped: U.S. States By Number of Cities Over 250,000 Residents
-

 Culture1 week ago
Charted: How the Logos of Select Fashion Brands Have Evolved
-

 United States1 week ago
Mapped: Countries Where Recreational Cannabis is Legal
-

 Misc1 week ago
Visualized: Aircraft Carriers by Country
-

 Culture2 weeks ago
How Popular Snack Brand Logos Have Changed
-

 Mining2 weeks ago
Visualizing Copper Production by Country in 2023