Politics
Interactive: The World’s Nuclear Arsenals Over Time
Interactive: The World’s Nuclear Arsenals Over Time
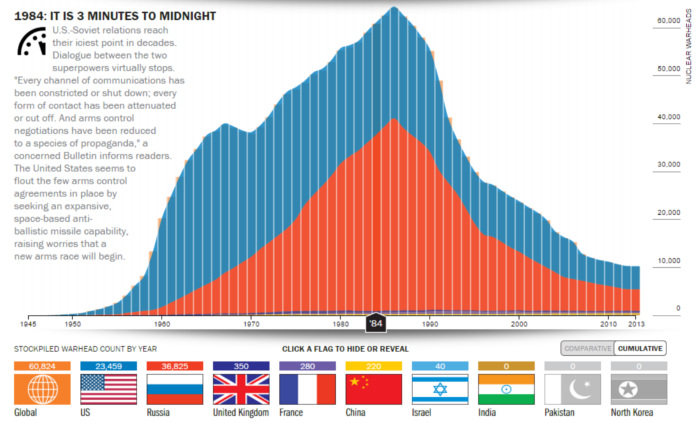
The Good News: There are far less nuclear warheads around than there were during the peak of the Cold War. In 1986, there were 64,099 stockpiled warheads and today there is less than 1/6 of that.
The Bad News: there are still enough to blow up the world 100x over, and on average each one is more powerful. Also, some countries that don’t like each other very much (India, Pakistan) are in possession of the technology.
The above interactive infographic puts it all in perspective over time. Data can be organized by choosing the countries’ arsenals to be viewed, and to also scroll along the years to see the international nuclear climate at a particular time.
Today, 91.5% of nukes are still held by either United States and Russia. The rest are held by the United Kingdom, France, India, Pakistan, China, and Israel. North Korea also holds the technology, including the capability to enrich uranium and recover plutonium from spent fuel rods. Pyongyang successfully launched a long-range missile in 2012 and has conducted three different underground nuclear tests in 2006, 2009, and 2013.
Original graphic by: The Nuclear Bulletin
United States
Charted: What Southeast Asia Thinks About China & the U.S.
A significant share of respondents from an ASEAN-focused survey are not happy about rising American and Chinese influence in the region.
What Southeast Asia Thinks About China & the U.S.
This was originally posted on our Voronoi app. Download the app for free on iOS or Android and discover incredible data-driven charts from a variety of trusted sources.
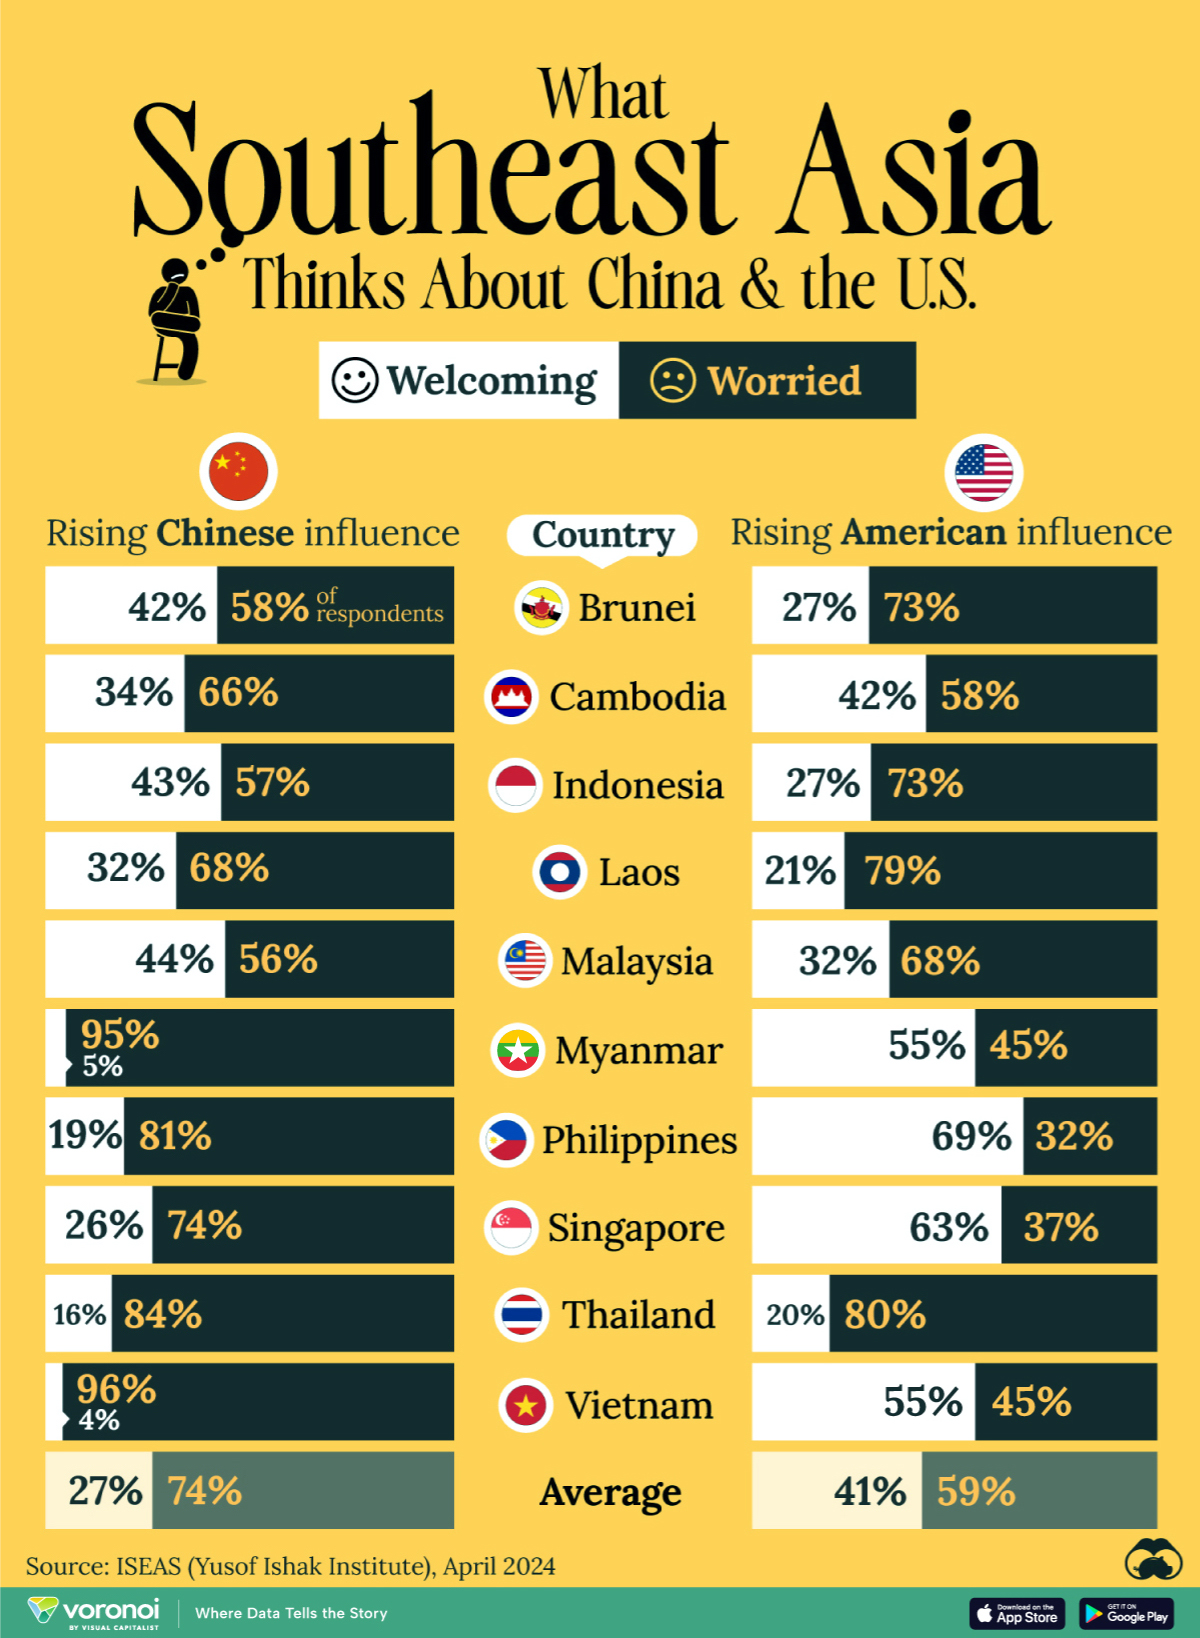
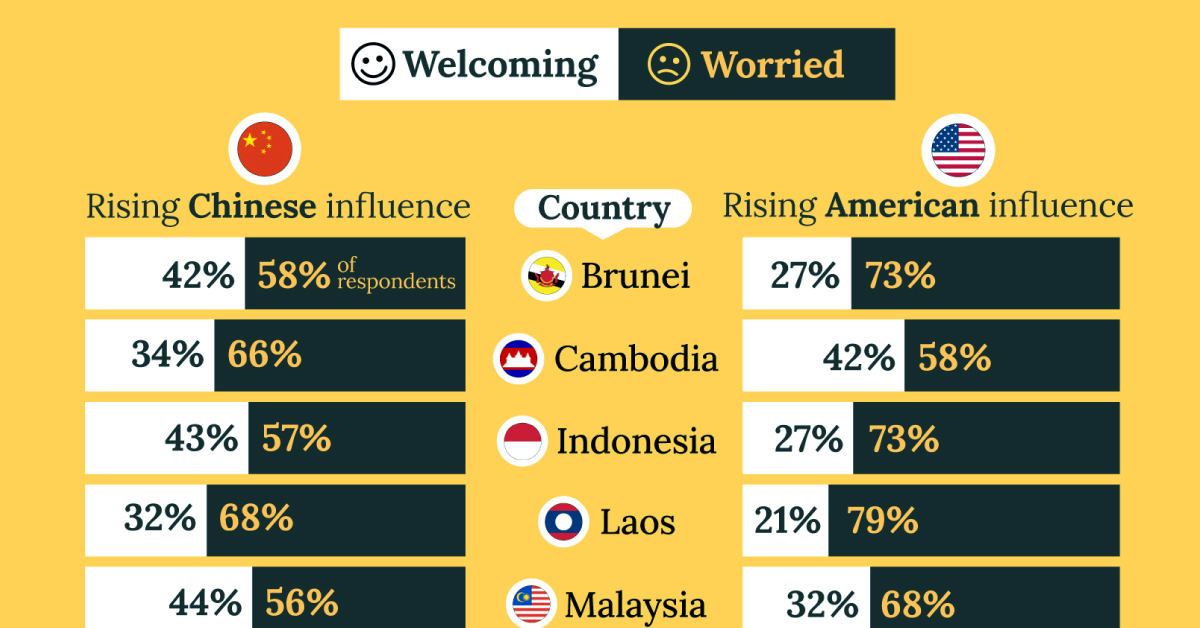
This chart visualizes the results of a 2024 survey conducted by the ASEAN Studies Centre at the ISEAS-Yusof Ishak Institute. Nearly 2,000 respondents were asked if they were worried or welcoming of rising Chinese and American geopolitical influence in their country.
The countries surveyed all belong to the Association of Southeast Asian Nations (ASEAN), a political and economic union of 10 states in Southeast Asia.
Feelings Towards China
On average, a significant share of respondents from all 10 countries are worried about rising influence from both the U.S. and China.
However, overall skepticism is higher for China, at 74% (versus 59% for U.S.).
| Country | Worried About Growing 🇨🇳 Influence | Welcome Growing 🇨🇳 Influence |
|---|---|---|
| 🇧🇳 Brunei | 58% | 42% |
| 🇰🇭 Cambodia | 66% | 34% |
| 🇮🇩 Indonesia | 57% | 43% |
| 🇱🇦 Laos | 68% | 32% |
| 🇲🇾 Malaysia | 56% | 44% |
| 🇲🇲 Myanmar | 95% | 5% |
| 🇵🇭 Philippines | 81% | 19% |
| 🇸🇬 Singapore | 74% | 26% |
| 🇹🇭 Thailand | 84% | 16% |
| 🇻🇳 Vietnam | 96% | 4% |
| Average | 74% | 27% |
The recently-cooled but still active territorial concerns over the South China Sea may play a significant role in these responses, especially in countries which are also claimants over the sea.
For example, in Vietnam over 95% of respondents said they were worried about China’s growing influence.
Feelings Towards America
Conversely, rising American influence is welcomed in two countries with competing claims in the South China Sea, the Philippines (69%) and Vietnam (55%).
| Country | Worried About Growing 🇺🇸 Influence | Welcome Growing 🇺🇸 Influence |
|---|---|---|
| 🇧🇳 Brunei | 73% | 27% |
| 🇰🇭 Cambodia | 58% | 42% |
| 🇮🇩 Indonesia | 73% | 27% |
| 🇱🇦 Laos | 79% | 21% |
| 🇲🇾 Malaysia | 68% | 32% |
| 🇲🇲 Myanmar | 45% | 55% |
| 🇵🇭 Philippines | 32% | 69% |
| 🇸🇬 Singapore | 37% | 63% |
| 🇹🇭 Thailand | 80% | 20% |
| 🇻🇳 Vietnam | 45% | 55% |
| Average | 59% | 41% |
Despite this, on a regional average, more respondents worry about growing American influence (59%) than they welcome it (41%).
Interestingly, it seems almost every ASEAN nation has a clear preference for one superpower over the other.
The only exception is Thailand, where those surveyed were not a fan of either option, with 84% worried about China, and 80% worried about the U.S.

-

 Markets6 days ago
Visualized: Interest Rate Forecasts for Advanced Economies
-

 Markets2 weeks ago
Economic Growth Forecasts for G7 and BRICS Countries in 2024
-

 Wealth2 weeks ago
Charted: Which City Has the Most Billionaires in 2024?
-

 Technology2 weeks ago
All of the Grants Given by the U.S. CHIPS Act
-

 Green2 weeks ago
The Carbon Footprint of Major Travel Methods
-

 United States1 week ago
Visualizing the Most Common Pets in the U.S.
-

 Culture1 week ago
The World’s Top Media Franchises by All-Time Revenue
-

 voronoi1 week ago
Best Visualizations of April on the Voronoi App