Energy
Europe’s Electricity Production by Country and Fuel Type
The share of electricity generated by different energy sources has changed significantly in Europe over the last two decades.
The major story here is the decline in consumption of fossil fuels. More specifically, the combined share of petroleum products and solid fuels (meaning coal or shale oil) has fallen from 65.1% of total consumption in 1990 to 50.6% by 2013.
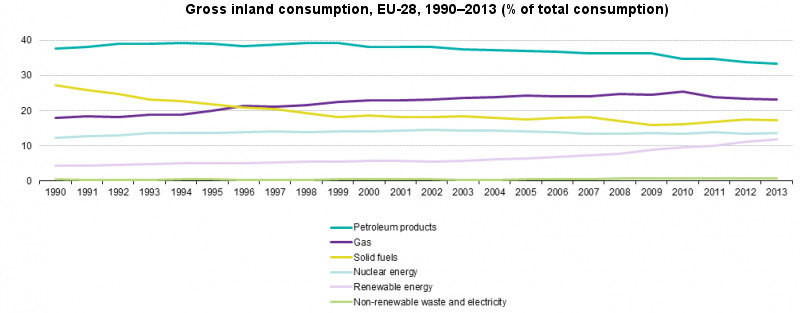
Renewables have steadily increased in consumption since the mid-2000s, and as a result the amount of electricity driven by renewables was 2.8x higher in 2013 (11.8%) than it was in 1990 (4.3%). The energy source that has seen the least fluctuations in usage is nuclear energy. Producing a peak of 14.5% of electricity in 2002, nuclear energy usage has recently dropped back to 13.6% in 2013.
Consumption of gas is also an interesting story. Natural gas has been used more prominently in recent years as it became regarded as more environmentally friendly than other fossil alternatives. However, as Europe has tried to reduce dependence on Russian gas, consumption has started to wane since 2010.
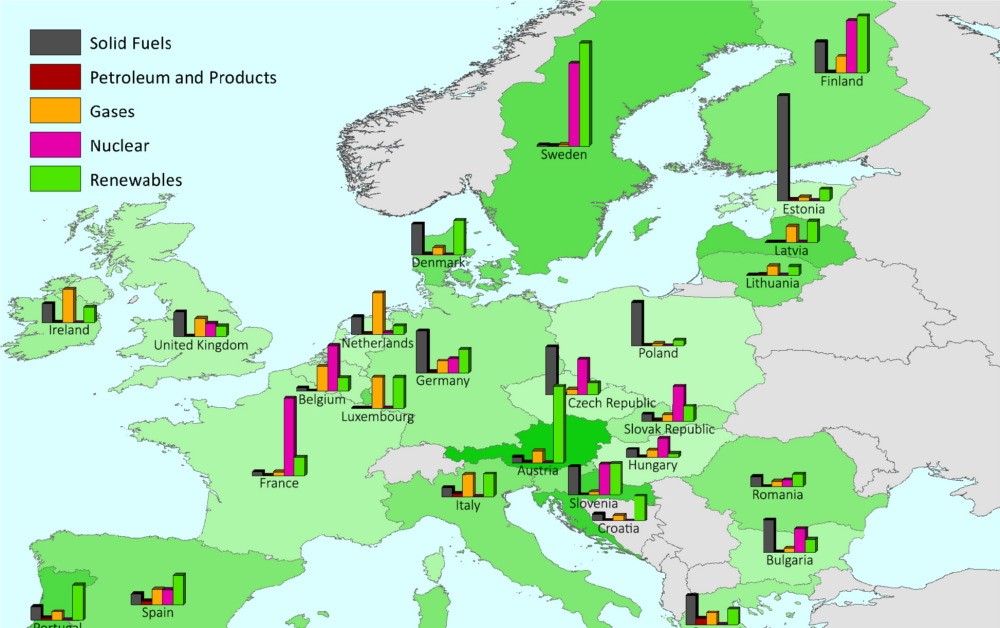
Here’s how specific countries look in terms of their electricity consumption per capita:
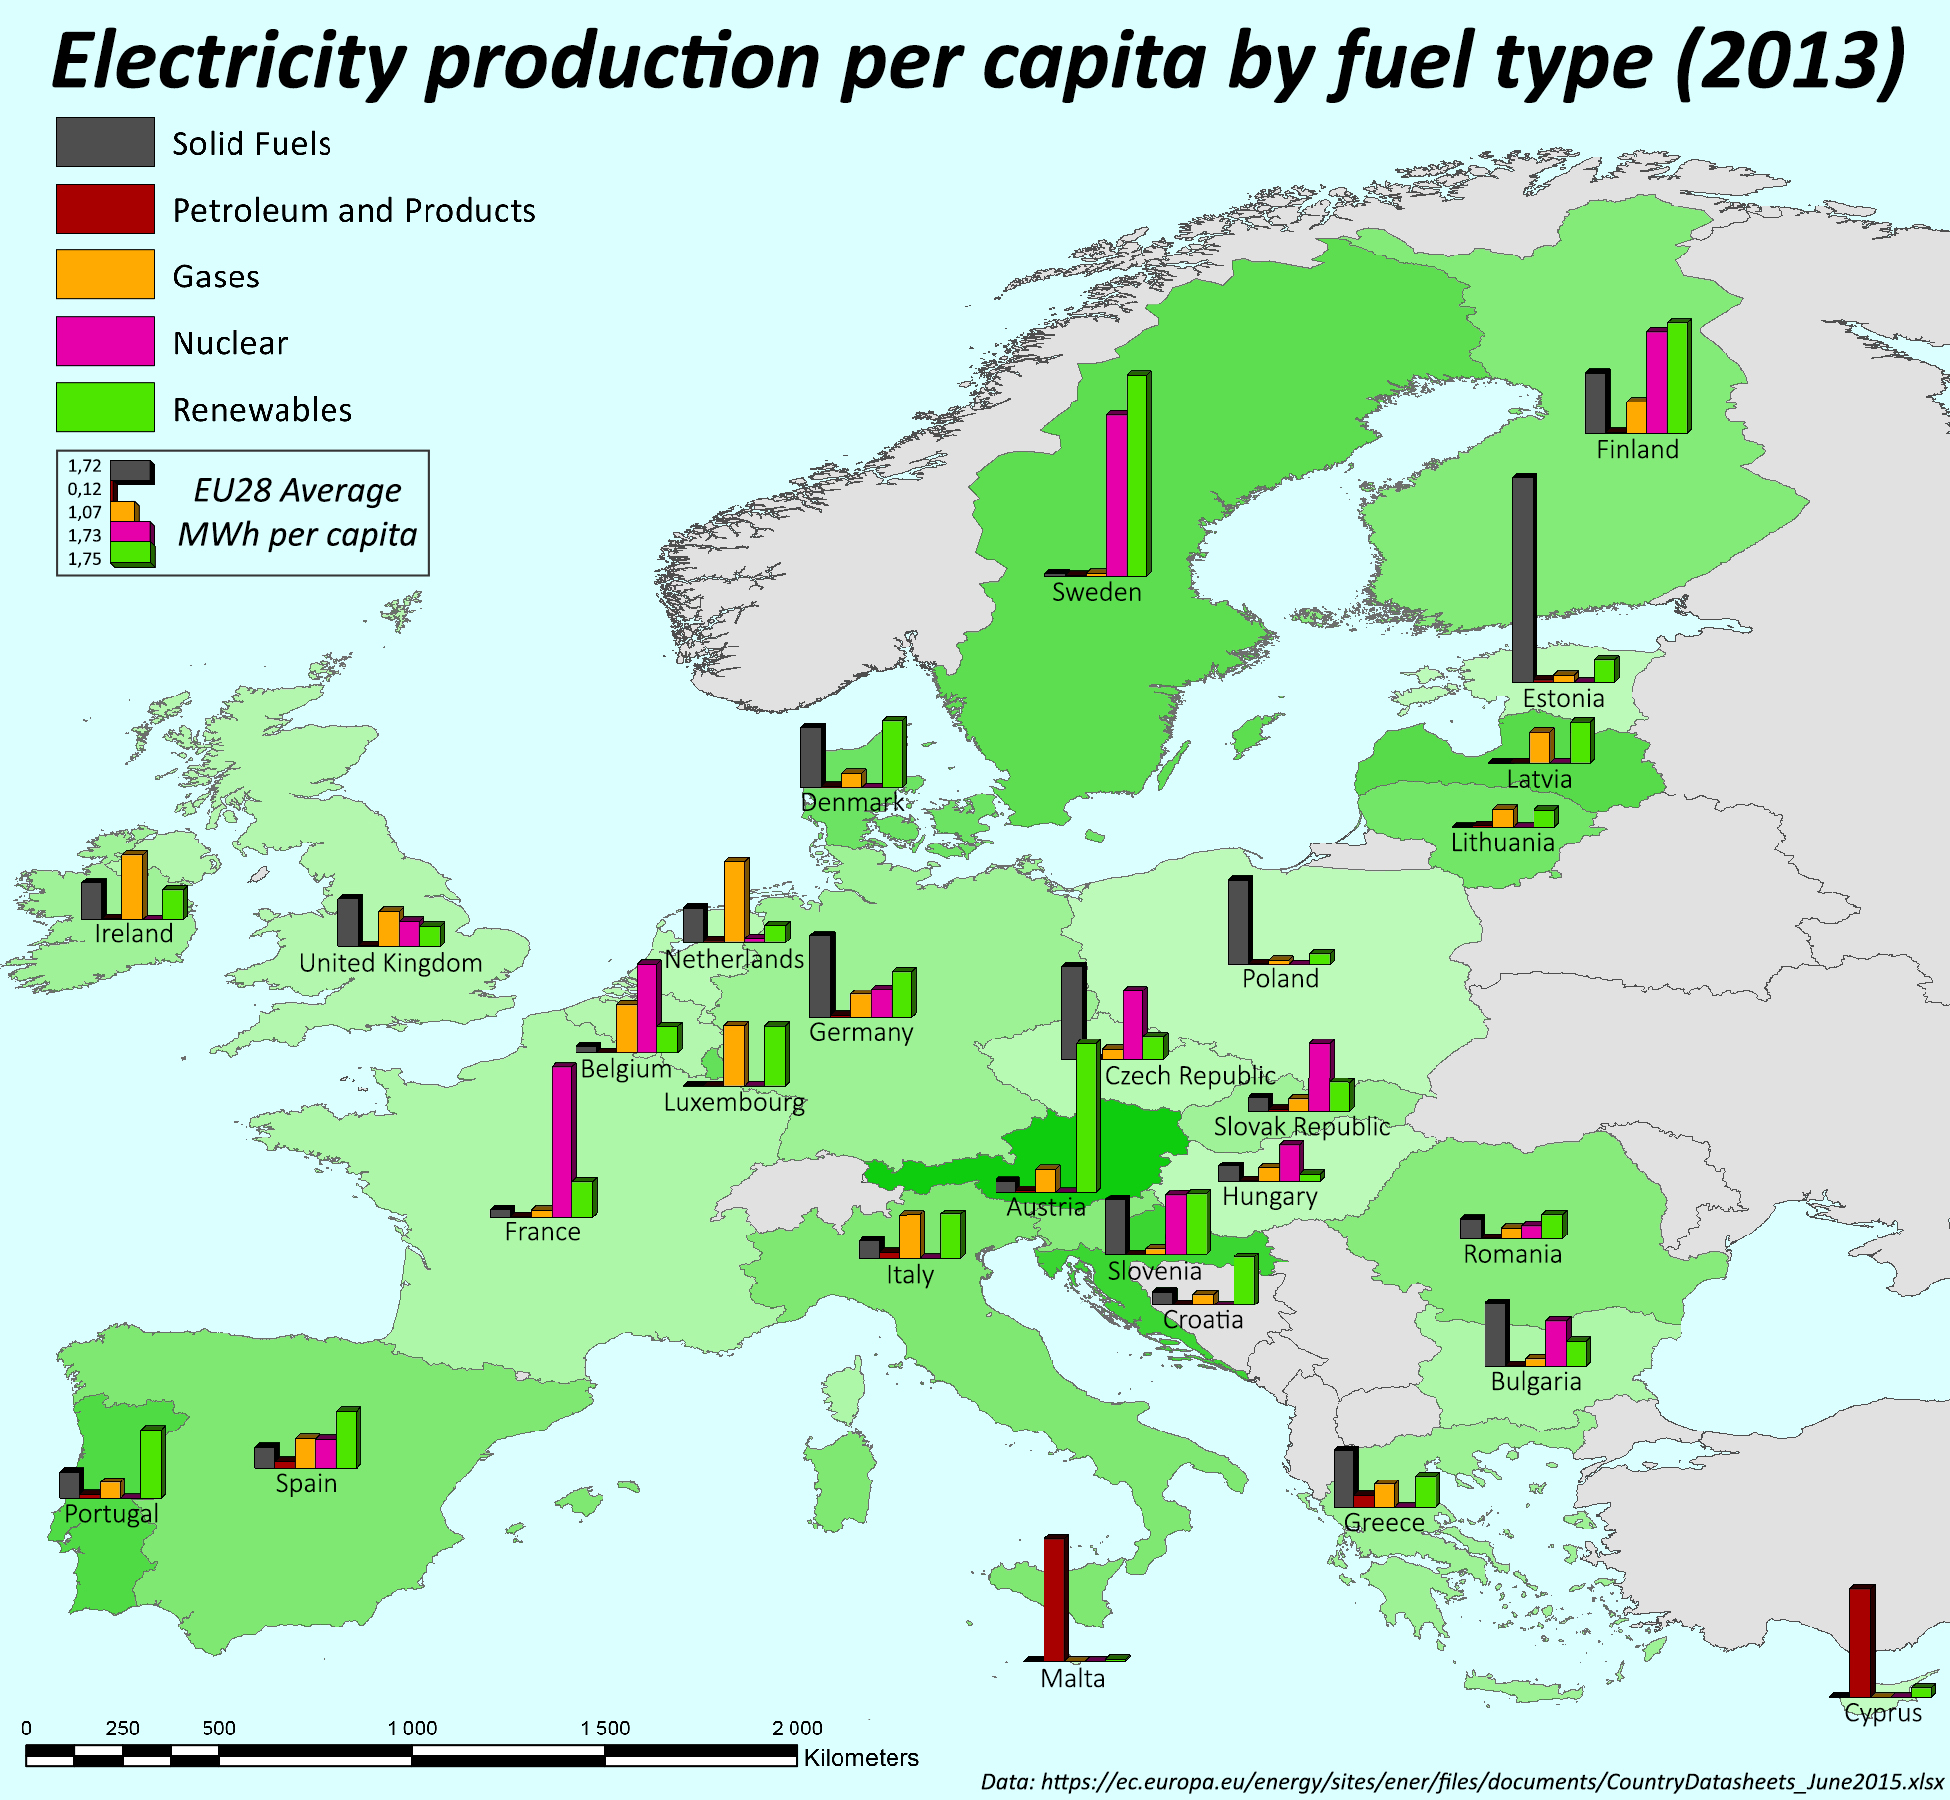
This creates some more granular stories that are worth delving into.
Estonia is the country that relies the most on solid fuels, with 86.6% of its energy needs met this fuel type. Interestingly, coal is not the solid fuel that is powering most of the country – that accolade goes to Estonia’s highly-developed and strategic shale oil resource. In this case, shale oil counts as a “solid fuel”, as it is essentially sedimentary rocks with oil trapped in them. Estonia actually has the two largest shale oil power plants in the world, and the industry employs 6,500 people in the country.
Malta and Cyprus rely heavily on petroleum products, which account for 98.3% and 92.4% of consumption respectively. This makes sense, as these small island nations do not have the populations or resources to warrant big infrastructure spending on things like nuclear power plants. They simply import what they need, which allows them flexibility.
France is the biggest user of nuclear power, with 74% of consumption coming from that source. Belgium, Hungary, and Slovakia have more than half of their power coming from nuclear.
Austria uses the most renewable energy with 80%. That said, the vast majority of this comes from hydro, where Austria uses its mountainous terrain to its advantage.
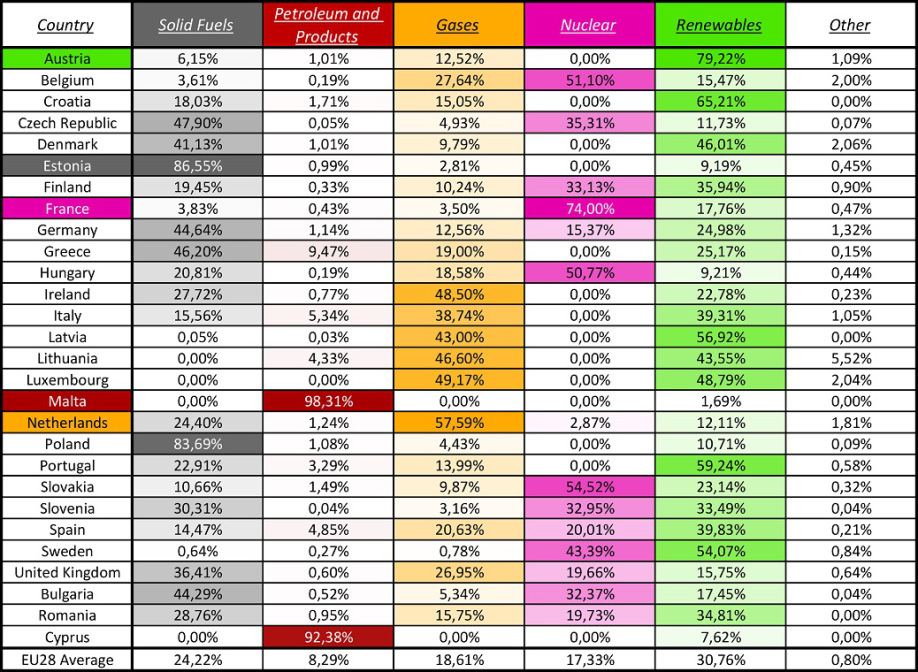
Want to dive more into the data? Here it is in its full glory:
Original graphics by: afschakelplan, Eurostat


Who’s Building the Most Solar Energy?
This was originally posted on our Voronoi app. Download the app for free on iOS or Android and discover incredible data-driven charts from a variety of trusted sources.
In 2023, solar energy accounted for three-quarters of renewable capacity additions worldwide. Most of this growth occurred in Asia, the EU, and the U.S., continuing a trend observed over the past decade.
In this graphic, we illustrate the rise in installed solar photovoltaic (PV) capacity in China, the EU, and the U.S. between 2010 and 2022, measured in gigawatts (GW). Bruegel compiled the data..
Chinese Dominance
As of 2022, China’s total installed capacity stands at 393 GW, nearly double that of the EU’s 205 GW and surpassing the USA’s total of 113 GW by more than threefold in absolute terms.
| Installed solar capacity (GW) | China | EU27 | U.S. |
|---|---|---|---|
| 2022 | 393.0 | 205.5 | 113.0 |
| 2021 | 307.0 | 162.7 | 95.4 |
| 2020 | 254.0 | 136.9 | 76.4 |
| 2019 | 205.0 | 120.1 | 61.6 |
| 2018 | 175.3 | 104.0 | 52.0 |
| 2017 | 130.8 | 96.2 | 43.8 |
| 2016 | 77.8 | 91.5 | 35.4 |
| 2015 | 43.6 | 87.7 | 24.2 |
| 2014 | 28.4 | 83.6 | 18.1 |
| 2013 | 17.8 | 79.7 | 13.3 |
| 2012 | 6.7 | 71.1 | 8.6 |
| 2011 | 3.1 | 53.3 | 5.6 |
| 2010 | 1.0 | 30.6 | 3.4 |
Since 2017, China has shown a compound annual growth rate (CAGR) of approximately 25% in installed PV capacity, while the USA has seen a CAGR of 21%, and the EU of 16%.
Additionally, China dominates the production of solar power components, currently controlling around 80% of the world’s solar panel supply chain.
In 2022, China’s solar industry employed 2.76 million individuals, with manufacturing roles representing approximately 1.8 million and the remaining 918,000 jobs in construction, installation, and operations and maintenance.
The EU industry employed 648,000 individuals, while the U.S. reached 264,000 jobs.
According to the IEA, China accounts for almost 60% of new renewable capacity expected to become operational globally by 2028.
Despite the phasing out of national subsidies in 2020 and 2021, deployment of solar PV in China is accelerating. The country is expected to reach its national 2030 target for wind and solar PV installations in 2024, six years ahead of schedule.

-

 Economy7 days ago
Ranked: The Top 20 Countries in Debt to China
-

 Demographics2 weeks ago
The Countries That Have Become Sadder Since 2010
-

 Money2 weeks ago
Charted: Who Has Savings in This Economy?
-

 AI2 weeks ago
Visualizing AI Patents by Country
-

 Economy2 weeks ago
Economic Growth Forecasts for G7 and BRICS Countries in 2024
-

 Wealth2 weeks ago
Charted: Which City Has the Most Billionaires in 2024?
-

 Technology1 week ago
All of the Grants Given by the U.S. CHIPS Act
-

 Green1 week ago
The Carbon Footprint of Major Travel Methods