Markets
The World’s Biggest Mutual Fund and ETF Providers


The Briefing
- The 10 largest mutual fund and ETF providers did not change from 2021 to 2022.
- Vanguard and iShares, the top two brands, both saw net inflows in 2022.
The World’s Biggest Mutual Fund and ETF Providers
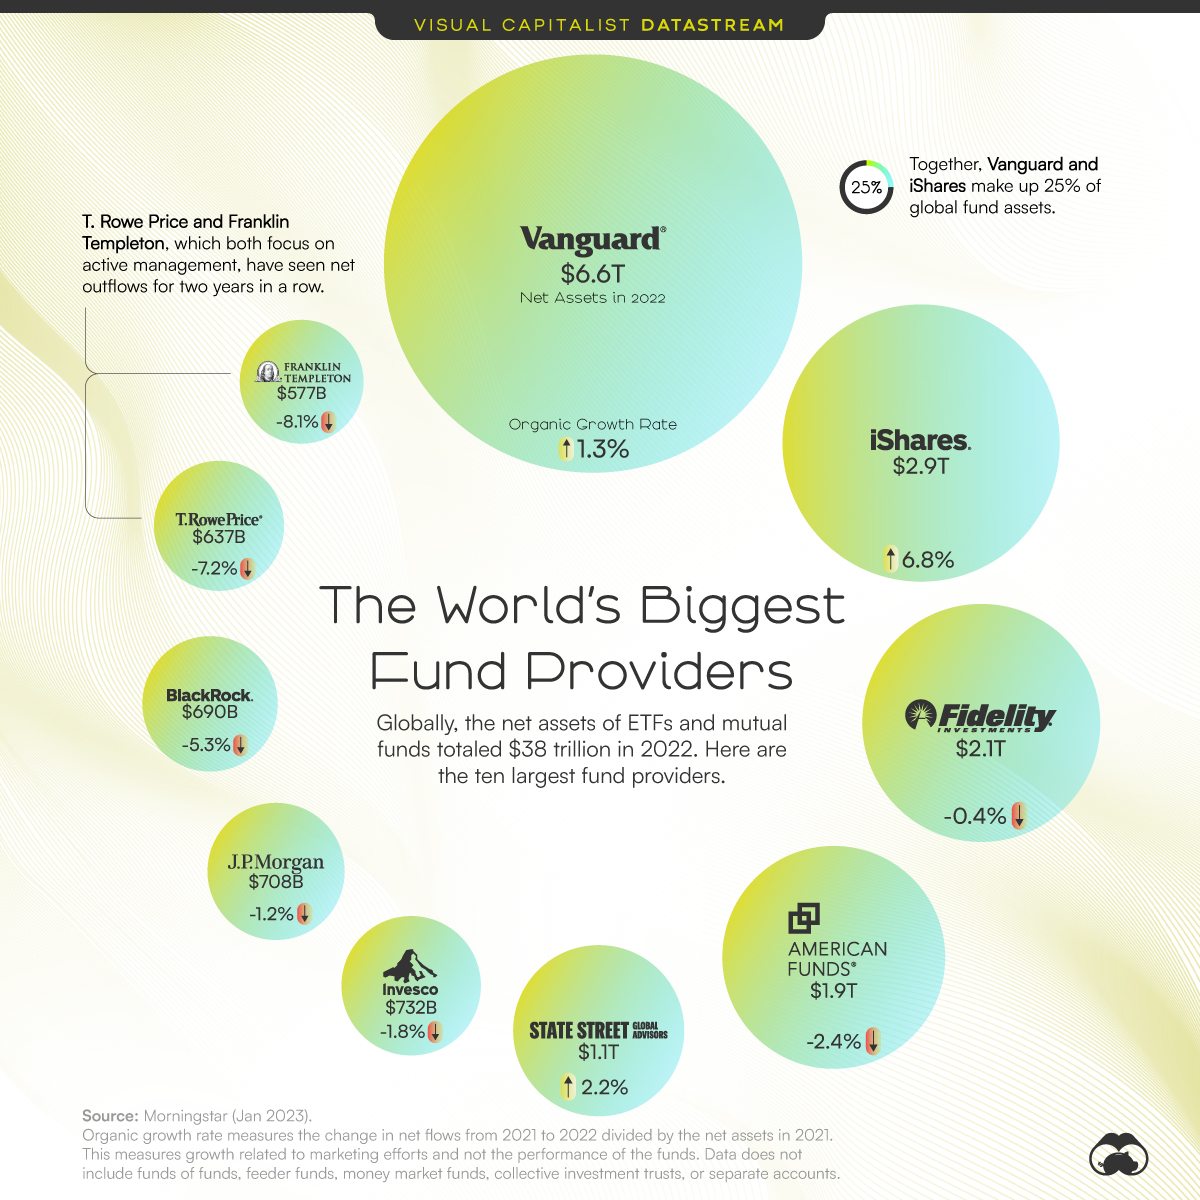
The global net assets of mutual fund and ETF providers totaled $38 trillion in 2022. Despite its massive size, the industry is dominated by a relatively small number of brands.
This graphic uses data from Morningstar to show the largest fund brands and their growth rates in 2022.
The Biggest Get Bigger
Below, we rank mutual fund and ETF brands by net assets and show their organic growth rate.
The organic growth rate measures the change in net flows, which reflects growth related to marketing efforts and not the market performance of the provider’s funds.
| Rank | Fund Provider | Net Assets in 2022 | Organic Growth Rate (2021-2022) |
|---|---|---|---|
| 1 | Vanguard | $6.6T | 1.3% |
| 2 | iShares | $2.9T | 6.8% |
| 3 | Fidelity | $2.1T | -0.4% |
| 4 | American Funds | $1.9T | -2.4% |
| 5 | State Street | $1.1T | 2.2% |
| 6 | Invesco | $732B | -1.8% |
| 7 | JPMorgan | $708B | -1.2% |
| 8 | BlackRock | $690B | -5.3% |
| 9 | T. Rowe Price | $637B | -7.2% |
| 10 | Franklin Templeton | $577B | -8.1% |
Vanguard and iShares continue to dominate the list and account for 25% of mutual fund and ETF net assets globally. Both saw net inflows, though iShares’ growth rate was much higher. It collected $222B, more than double the $101 billion that Vanguard received.
State Street, the fifth-largest fund brand, was the only other name on the list to see net inflow. The company manages the SPDR S&P 500 ETF, which is the largest ETF in the world. It was a top pick for retail investors in early 2023.
The smallest of the giants—T. Rowe Price and Franklin Templeton—saw net outflows for the second year in a row. Both firms focus on active management, a strategy designed to outperform the general market through the decisions of investment managers.
Shifting Preferences: From Mutual Fund to ETF
The decline of brands focused on active management reflects a larger trend within the industry. In 2022, investors heavily favored passive funds and ETFs over mutual funds and active funds.
This could be due to the higher fees and long-term underperformance of many active funds.
| Fund Type | Inflows (+) or Outflows (-) in 2022 |
|---|---|
| Mutual Funds | -$1.3T |
| Actively-Managed Funds | -$349B |
| ETFs | +$754B |
| Indexed (Passive) Funds | +$348B |
Passive funds now comprise 38% of global assets, up from 19% in 2013.
Typically, passive funds have very low expense ratios that limit the fees providers can earn. Existing brands also have large economies of scale that would be difficult for new entrants to replicate. For these reasons, fewer firms compete in passive management and this is ultimately leading to more consolidation in the industry.
Fortunately, investors have benefited from the cost-effective and efficient path to investment ownership that passive funds provide. In 2022, the average expense ratio of an actively-managed equity mutual fund was 0.66%, while the average for an index equity mutual fund was 0.05%.
On the flip side, some experts have expressed concerns that industry consolidation reduces financial stability. The Federal Reserve states that if a large firm experienced a significant event, such as a cybersecurity breach, it could “lead to sudden massive redemptions from that firm’s funds and thus potentially from the asset management industry as a whole.”
Where Does This Data Come From?
Source: Morningstar Global Fund Flows Report
Data note: Organic growth rate measures the change in net flows from 2021 to 2022 divided by the net assets in 2021. This measures growth related to marketing efforts and not the performance of the funds. Data does not include funds of funds, feeder funds, money market funds, collective investment trusts, or separate accounts.


Markets
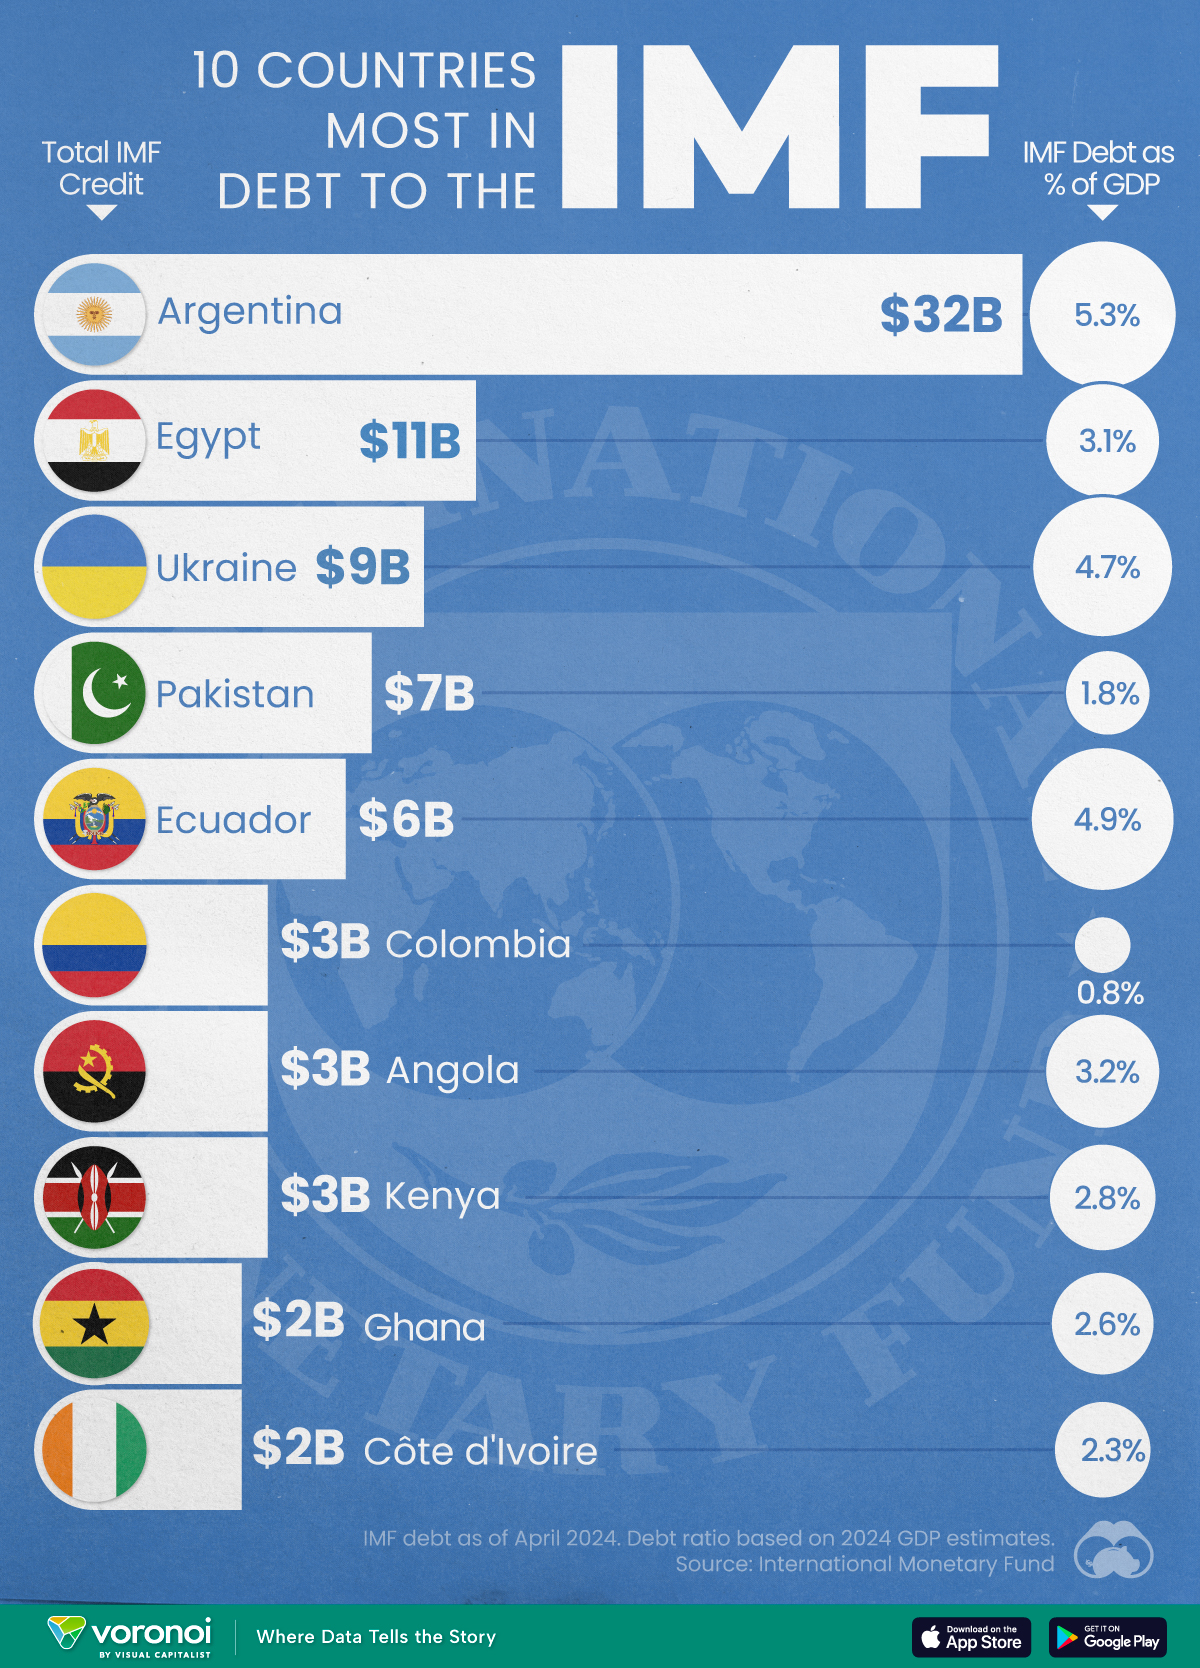
Top 10 Countries Most in Debt to the IMF
Argentina tops the ranking, with a debt equivalent to 5.3% of the country’s GDP.
Top 10 Countries Most in Debt to the IMF
This was originally posted on our Voronoi app. Download the app for free on iOS or Android and discover incredible data-driven charts from a variety of trusted sources.
Established in 1944, the International Monetary Fund (IMF) supports countries’ economic growth by providing financial aid and guidance on policies to enhance stability, productivity, and job opportunities.
Countries seek loans from the IMF to address economic crises, stabilize their currencies, implement structural reforms, and alleviate balance of payments difficulties.
In this graphic, we visualize the 10 countries most indebted to the fund.
Methodology
We compiled this ranking using the International Monetary Fund’s data on Total IMF Credit Outstanding. We selected the latest debt data for each country, accurate as of April 29, 2024.
Argentina Tops the Rank
Argentina’s debt to the IMF is equivalent to 5.3% of the country’s GDP. In total, the country owns more than $32 billion.
| Country | IMF Credit Outstanding ($B) | GDP ($B, 2024) | IMF Debt as % of GDP |
|---|---|---|---|
| 🇦🇷 Argentina | 32 | 604.3 | 5.3 |
| 🇪🇬 Egypt | 11 | 347.6 | 3.1 |
| 🇺🇦 Ukraine | 9 | 188.9 | 4.7 |
| 🇵🇰 Pakistan | 7 | 374.7 | 1.8 |
| 🇪🇨 Ecuador | 6 | 121.6 | 4.9 |
| 🇨🇴 Colombia | 3 | 386.1 | 0.8 |
| 🇦🇴 Angola | 3 | 92.1 | 3.2 |
| 🇰🇪 Kenya | 3 | 104.0 | 2.8 |
| 🇬🇭 Ghana | 2 | 75.2 | 2.6 |
| 🇨🇮 Ivory Coast | 2 | 86.9 | 2.3 |
A G20 member and major grain exporter, the country’s history of debt trouble dates back to the late 1890s when it defaulted after contracting debts to modernize the capital, Buenos Aires. It has already been bailed out over 20 times in the last six decades by the IMF.
Five of the 10 most indebted countries are in Africa, while three are in South America.
The only European country on our list, Ukraine has relied on international support amidst the conflict with Russia. It is estimated that Russia’s full-scale invasion of the country caused the loss of a third of the country’s economy. The country owes $9 billion to the IMF.
In total, almost 100 countries owe money to the IMF, and the grand total of all of these debts is $111 billion. The above countries (top 10) account for about 69% of these debts.

-

 Technology1 week ago
Mapped: The Number of AI Startups By Country
-

 Automotive7 days ago
How People Get Around in America, Europe, and Asia
-

 Personal Finance1 week ago
Visualizing the Tax Burden of Every U.S. State
-

 Mining1 week ago
Where the World’s Aluminum is Smelted, by Country
-

 Technology1 week ago
Countries With the Highest Rates of Crypto Ownership
-

 Money1 week ago
Charted: What Frustrates Americans About the Tax System
-

 Economy1 week ago
Mapped: Europe’s GDP Per Capita, by Country
-

 Stocks1 week ago
The Growth of a $1,000 Equity Investment, by Stock Market