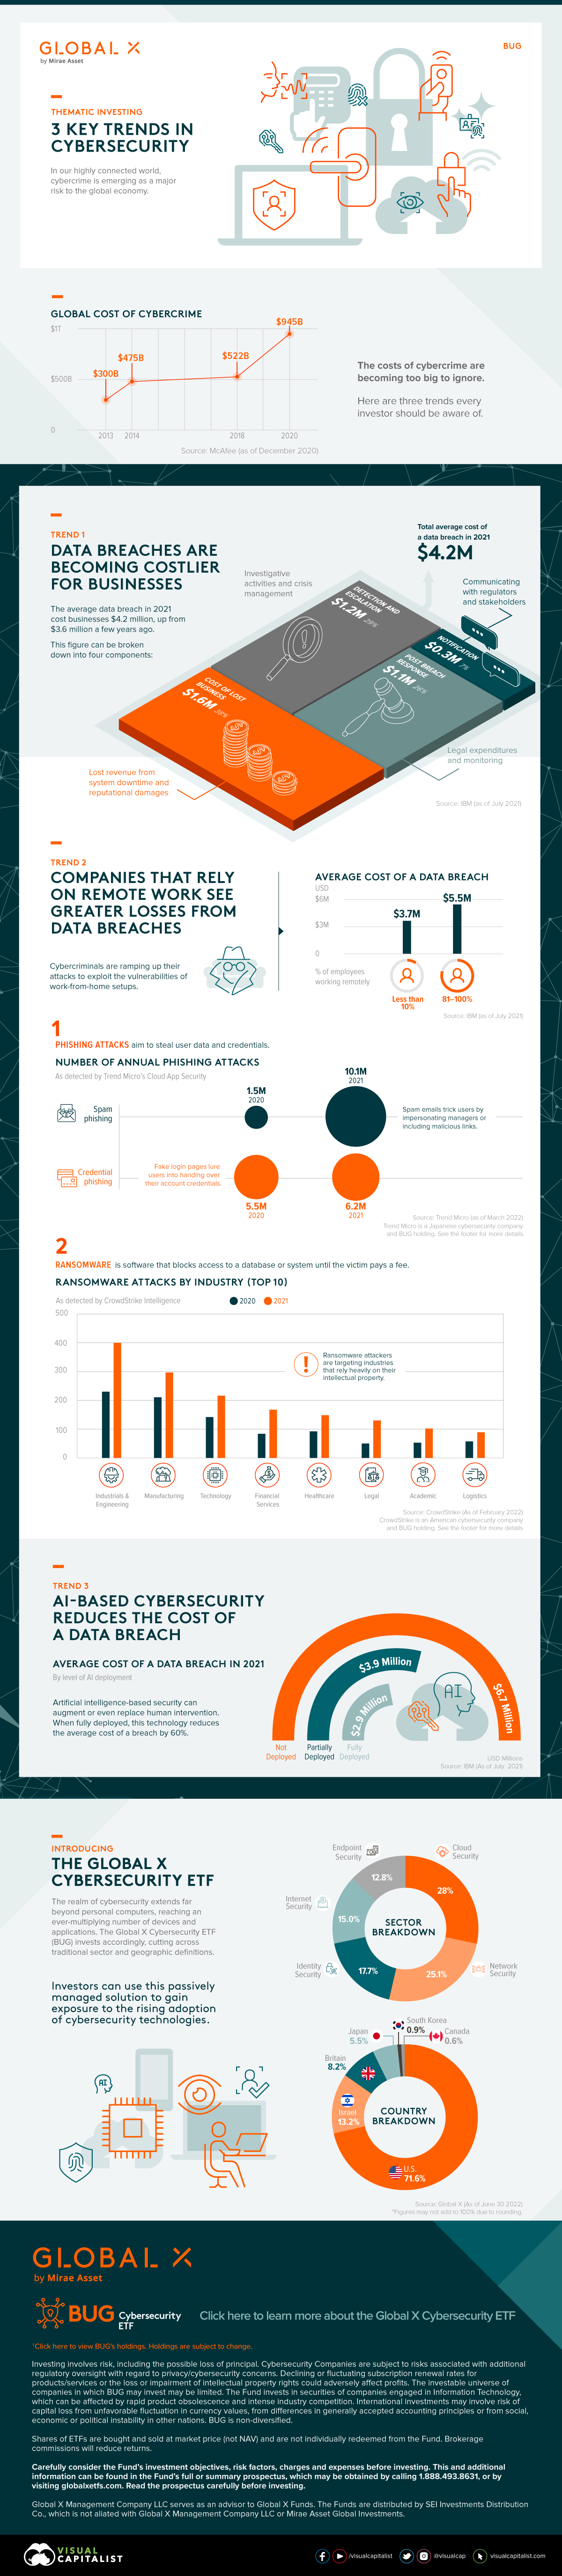
Thematic Investing: 3 Key Trends in Cybersecurity
Thematic Investing: 3 Key Trends in Cybersecurity
In 2020, the global cost of cybercrime was estimated to be around $945 billion, according to McAfee.
It’s likely even higher today, as multiple sources have recorded an increase in the frequency and sophistication of cyberattacks during the pandemic.
In this infographic from Global X ETFs, we highlight three major trends that are shaping the future of the cybersecurity industry that investors need to know.
Trend 1: Increasing Costs
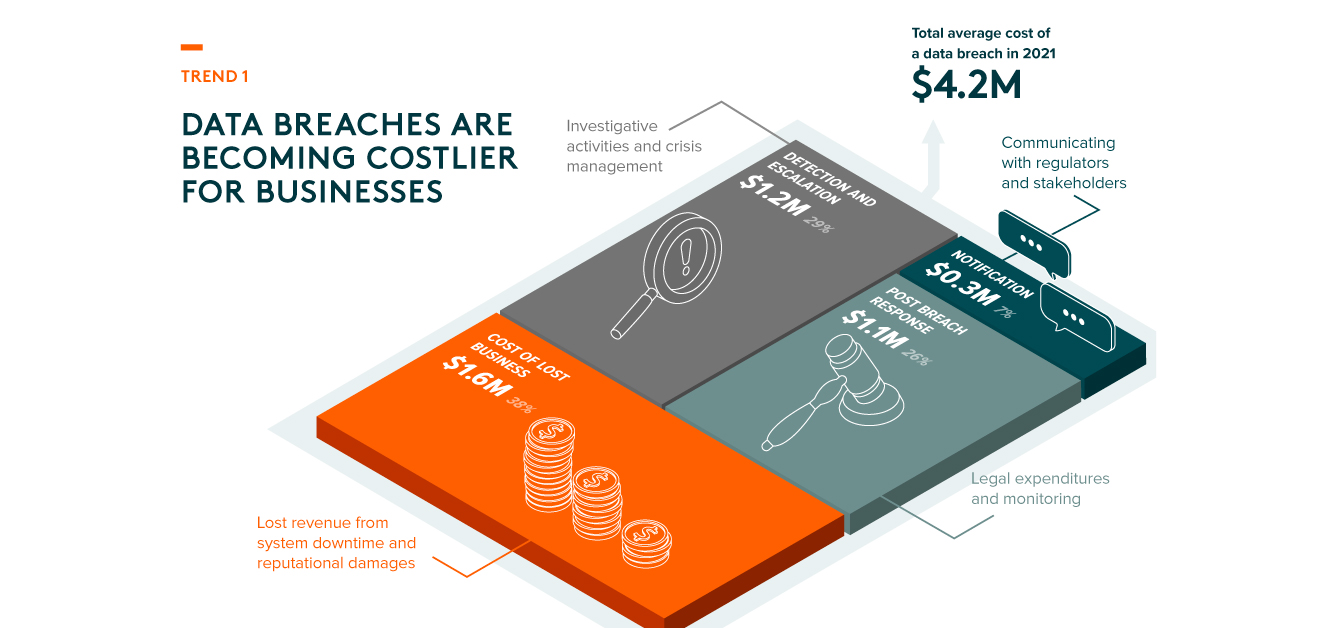
Research from IBM determined that the average data breach cost businesses $4.2 million in 2021, up from $3.6 million in 2017. The following table breaks this figure into four components:
| Cost Component | Value ($) |
|---|---|
| Cost of lost business | $1.6M |
| Detection and escalation | $1.2M |
| Post breach response | $1.1M |
| Notification | $0.3M |
| Total | $4.2M |
The greatest cost of a data breach is lost business, which results from system downtimes, reputational losses, and lost customers. Second is detection and escalation, including investigative activities, audit services, and communications to stakeholders.
Post breach response includes costs such as legal expenditures, issuing new accounts or credit cards (in the case of financial institutions), and other monitoring services. Lastly, notification refers to the cost of notifying regulators, stakeholders, and other third parties.
To stay ahead of these rising costs, businesses are placing more emphasis on cybersecurity. For example, Microsoft announced in September 2021 that it would quadruple its cybersecurity investments to $20 billion over the next five years.
Trend 2: Remote Work Opens New Vulnerabilities
According to IBM, companies that rely more on remote work experience greater losses from data breaches. For companies where 81 to 100% of employees were remote, the average cost of a data breach was $5.5 million (2021). This dropped to $3.7 million for companies that had under 10% of employees working from home.
A major reason for this gap is that work-from-home setups are typically less secure. Phishing attacks surged in 2021, taking advantage of the fact that many employees access corporate systems through their personal devices.
| Type of Attack | Number of attacks in 2020 | Number of attacks in 2021 | Growth (%) |
|---|---|---|---|
| Spam phishing | 1.5M | 10.1M | +573% |
| Credential phishing | 5.5M | 6.2M | +13% |
As detected by Trend Micro’s Cloud App Security.
Spam phishing refers to “fake” emails that trick users by impersonating company management. They can include malicious links that download ransomware onto the users device. Credential phishing is similar in concept, though the goal is to steal a person’s account credentials.
A tactic you may have seen before is the Amazon scam, where senders impersonate Amazon and convince users to update their payment methods. This strategy could also be used to gain access to a company’s internal systems.
Trend 3: AI Can Reduce the Cost of a Data Breach
AI-based cybersecurity can detect and respond to cyberattacks without any human intervention. When fully deployed, IBM measured a 20% reduction in the time it takes to identify and contain a breach. It also resulted in cost savings upwards of 60%.
A prominent user of AI-based cybersecurity is Google, which uses machine learning to detect phishing attacks within Gmail.
Machine learning helps Gmail block spam and phishing messages from showing up in your inbox with over 99.9% accuracy. This is huge, given that 50-70% of messages that Gmail receives are spam.
– Andy Wen, Google
As cybercrime escalates, Acumen Research and Consulting believes the market for AI-based security solutions will reach $134 billion by 2030, up from $15 billion in 2021.
Introducing the Global X Cybersecurity ETF
The Global X Cybersecurity ETF (Ticker: BUG) seeks to provide investment results that correspond generally to the price and yield performance, before fees and expenses, of the Indxx Cybersecurity Index. See below for industry and country-level breakdowns, as of June 2022.
| Sector (By security type) | Weight |
|---|---|
| Cloud | 28.0% |
| Network | 25.1% |
| Identity | 17.7% |
| Internet | 15.0% |
| Endpoint | 12.8% |
| Country | Weight |
|---|---|
| 🇺🇸 U.S. | 71.6% |
| 🇮🇱 Israel | 13.2% |
| 🇬🇧 UK | 8.2% |
| 🇯🇵 Japan | 5.5% |
| 🇰🇷 South Korea | 0.9% |
| 🇨🇦 Canada | 0.6% |
Totals may not equal 100% due to rounding.
Investors can use this passively managed solution to gain exposure to the rising adoption of cybersecurity technologies.


-

 Technology1 day ago
Visualizing AI Patents by Country
See which countries have been granted the most AI patents each year, from 2012 to 2022.
-

 Technology3 days ago
How Tech Logos Have Evolved Over Time
From complete overhauls to more subtle tweaks, these tech logos have had quite a journey. Featuring: Google, Apple, and more.
-

 AI2 weeks ago
Ranked: Semiconductor Companies by Industry Revenue Share
Nvidia is coming for Intel’s crown. Samsung is losing ground. AI is transforming the space. We break down revenue for semiconductor companies.
-

 Technology2 weeks ago
The Stock Performance of U.S. Chipmakers So Far in 2024
The Nvidia rocket ship is refusing to slow down, leading the pack of strong stock performance for most major U.S. chipmakers.
-

 Technology3 weeks ago
Ranked: The Most Popular Smartphone Brands in the U.S.
This graphic breaks down America’s most preferred smartphone brands, according to a December 2023 consumer survey.
-

 Technology3 weeks ago
Visualizing Nvidia’s Revenue, by Product Line (2019-2024)
This graphic shows how Nvidia’s revenue sources have changed over time, highlighting how the AI boom has transformed its bottom line.