What Drove Market Volatility in 2023?
What Drove Market Volatility in 2023?
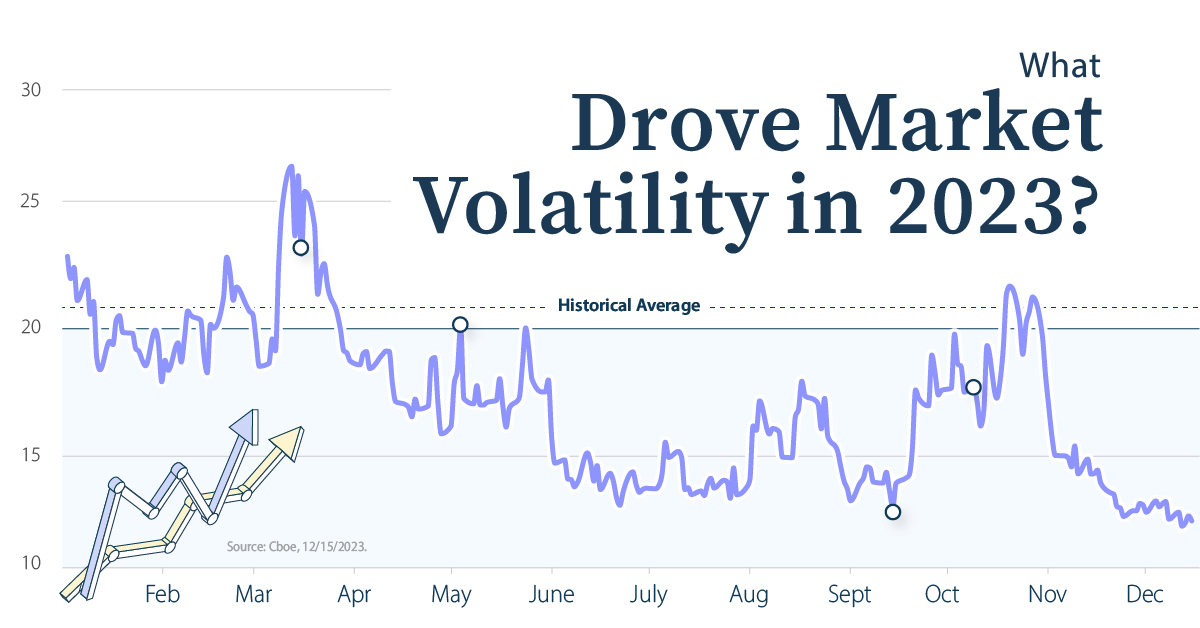
Market volatility was notably calm over 2023—in a striking contrast from last year.
In fact, the Cboe Volatility Index (VIX), a common measure for tracking volatility, dropped to four-year lows in December after the Fed signaled interest rate cuts in 2024.
This graphic, sponsored by New York Life Investments, shows the key factors that influenced volatility this year and how to navigate the path forward.
The Macroeconomic Climate
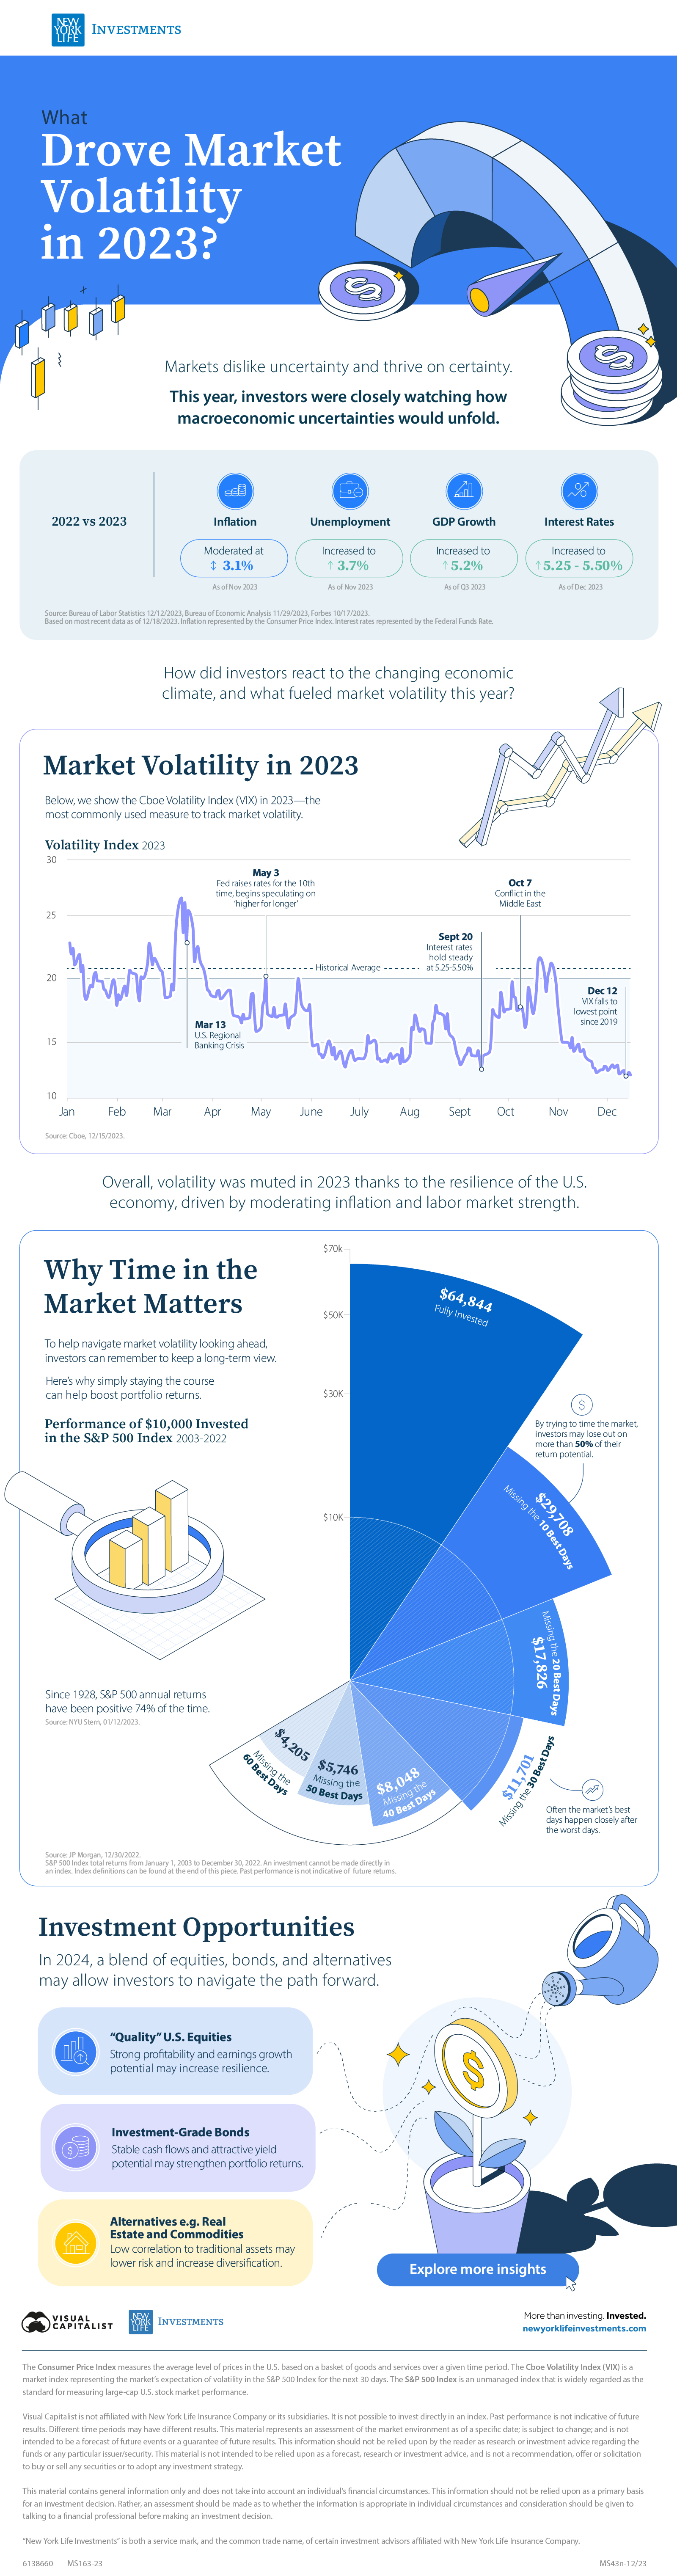
To start, investors were closely watching how macroeconomic uncertainties would unfold in 2023. Here’s how they compared to last year:
| Indicator | 2022 vs 2023 | Level | Date |
|---|---|---|---|
| Inflation | Moderated | 3.1% | Nov 2023 |
| Unemployment Rate | Increased | 3.7% | Nov 2023 |
| GDP Growth | Increased | 5.2% | Q3 2023 |
| Interest Rates | Increased | 5.25 - 5.50% | Dec 2023 |
How did investors react to the shifting economic climate, and did this cause volatility to spike?
Looking Back at Market Volatility
In 2023, moderating inflation, solid consumer spending, and labor market strength tempered investor fear, leading volatility to fall.
Yet there were a few noteworthy spikes. During the U.S. regional banking crisis in March, the VIX jumped above 30 amid heightened investor panic about bank profitability. Later in May, volatility spiked again after the Fed raised rates for the 10th time as it began speculating on ‘higher for longer’ rate scenarios.
After this point, volatility dropped significantly. Inflation had fallen for five consecutive months, hitting an annual low of 3% in June, down from 6.4% in January.
It was not until the growing conflict in the Middle East in October that volatility jumped—but following strong economic data in December, the VIX hit 12.1, its lowest point since late 2019.
Why Time in the Market Matters
While some argue that volatility could remain muted, others suggest it could increase again in 2024, citing an overheated market and credit market strains.
To help navigate market volatility looking ahead, investors can remember to keep a long-term view. Consider the hypothetical performance of an investor who stayed invested in the market versus missing out on its best days:
| Performance of $10,000 Invested in the S&P 500 Index 2003-2022 | Annual Return | |
|---|---|---|
| Fully Invested | $64,844 | +9.8% |
| Missing the 10 Best Days | $29,708 | +5.6% |
| Missing the 20 Best Days | $17,826 | +2.9% |
| Missing the 30 Best Days | $11,701 | +0.8% |
| Missing the 40 Best Days | $8,048 | -1.1% |
| Missing the 50 Best Days | $5,746 | -2.7% |
| Missing the 60 Best Days | $4,205 | -4.2% |
As the above table shows, by trying to time the market, investors may lose out on more than 50% of their return potential.
Not only that, the market’s best days often happen closely after the worst days. The good news is that since 1928, S&P 500 annual returns have been positive 74% of the time, reinforcing the value of sticking it out through market swings.
Investment Opportunities
In 2024, a blend of equities, bonds, and alternatives may allow investors to navigate volatility:
- “Quality” U.S. Equities: Strong profitability and earnings growth potential may increase resilience.
- Investment-Grade Bonds: Stable cash flows and attractive yield potential may strengthen returns.
- Alternatives e.g. Real Estate and Commodities: Low correlation to traditional assets may lower risk and increase diversification.
Together, a balanced portfolio may help capture return potential in the year ahead.
Explore more investment insights with New York Life Investments.

-

 Economy4 days ago
Economic Growth Forecasts for G7 and BRICS Countries in 2024
The IMF has released its economic growth forecasts for 2024. How do the G7 and BRICS countries compare?
-

 Markets2 weeks ago
U.S. Debt Interest Payments Reach $1 Trillion
U.S. debt interest payments have surged past the $1 trillion dollar mark, amid high interest rates and an ever-expanding debt burden.
-

 United States2 weeks ago
Ranked: The Largest U.S. Corporations by Number of Employees
We visualized the top U.S. companies by employees, revealing the massive scale of retailers like Walmart, Target, and Home Depot.
-

 Markets2 weeks ago
The Top 10 States by Real GDP Growth in 2023
This graphic shows the states with the highest real GDP growth rate in 2023, largely propelled by the oil and gas boom.
-

 Markets3 weeks ago
Ranked: The World’s Top Flight Routes, by Revenue
In this graphic, we show the highest earning flight routes globally as air travel continued to rebound in 2023.
-

 Markets3 weeks ago
Ranked: The Most Valuable Housing Markets in America
The U.S. residential real estate market is worth a staggering $47.5 trillion. Here are the most valuable housing markets in the country.