Misc
Rebuilding America: The Coming Opportunity in Infrastructure
It’s hard for most stakeholders to get excited about replacing an aging bridge.
Chaotic construction can disrupt the flow of traffic for many years, while annoying many of the local residents. Even worse, such projects usually go over budget, ultimately costing millions or even billions in taxpayer dollars.
At the end of the day, you have a new and improved bridge – but was it really worth all the hassle?
Rebuilding America
It’s not always easy to see short-term ROI in replacing aging infrastructure, especially when there are many other pressing challenges for society to tackle.
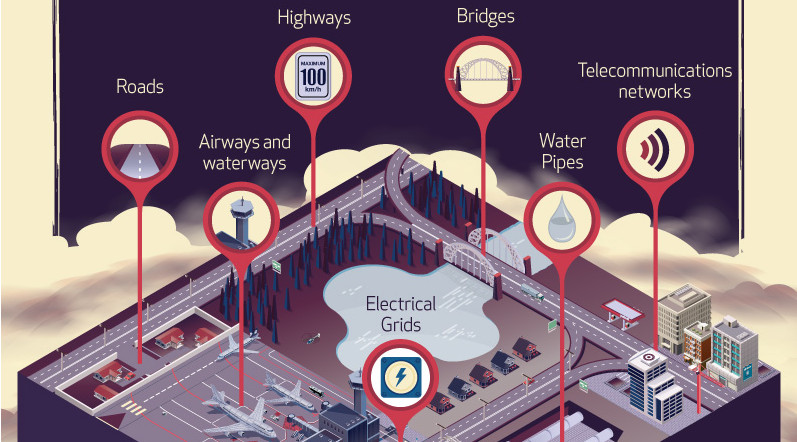
However, perpetually kicking the can down the road eventually leads to a situation that works in nobody’s favor. If streets, highways, rail, subways, airports, and bridges are all crumbling, the economy could eventually follow suit.

According to the latest report card by the American Society of Civil Engineers (ASCE), infrastructure in America barely gets a passing grade with a mark of D+.
Here is how things break down, by specific type of infrastructure:
| Infrastructure Type | Grade | Infrastructure Type | Grade | |
|---|---|---|---|---|
| Rail | B | Wastewater | D+ | |
| Solid waste | C+ | Roads | D | |
| Bridges | C+ | Aviation | D | |
| Ports | C+ | Dams | D | |
| Energy | D+ | Drinking water | D | |
| Hazardous waste | D+ | Inland waterways | D | |
| Schools | D+ | Levees | D | |
| Public Parks | D+ | Transit | D- |
The situation is grim – and the organization says that the country needs to spend an extra $2.1 trillion by 2025 to avoid making the situation worse.
Why Investors Should Care
Infrastructure is decidedly unsexy for investors.
However, it does come with some major benefits – in fact, JP Morgan Asset Management says that infrastructure investments tend to have low correlation with other asset classes, helping portfolio diversification. In addition, infrastructure is often protected from inflation, while providing a high yield and stable cash flows.
Here are some ways that regular investors can get access to the infrastructure sector:
- Materials stocks: Millions of tonnes of cement, concrete, steel, and other materials will be needed
- Construction and engineering stocks: These are the companies that will get the contracts to rebuild America
- Heavy machinery manufacturer stocks: Heavy machinery will be needed to get construction jobs done
- Infrastructure ETFs: Alternatively, there are thematic ETFs that build their funds around infrastructure
How will you try to play the coming infrastructure boom?


Misc
The Top 25 Nationalities of U.S. Immigrants
Mexico is the largest source of immigrants to the U.S., with almost 11 million immigrants.


The Top 25 Nationalities of U.S. Immigrants
This was originally posted on our Voronoi app. Download the app for free on iOS or Android and discover incredible data-driven charts from a variety of trusted sources.
The United States is home to more than 46 million immigrants, constituting approximately 14% of its total population.
This graphic displays the top 25 countries of origin for U.S. immigrants, based on 2022 estimates. The data is sourced from the Migration Policy Institute (MPI), which analyzed information from the U.S. Census Bureau’s 2022 American Community Survey.
In this context, “immigrants” refer to individuals residing in the United States who were not U.S. citizens at birth.
Mexico Emerges as a Leading Source of Immigration
Mexico stands out as the largest contributor to U.S. immigration due to its geographical proximity and historical ties.
Various economic factors, including wage disparities and employment opportunities, motivate many Mexicans to seek better prospects north of the border.
| Country | Region | # of Immigrants |
|---|---|---|
| 🇲🇽 Mexico | Latin America & Caribbean | 10,678,502 |
| 🇮🇳 India | Asia | 2,839,618 |
| 🇨🇳 China | Asia | 2,217,894 |
| 🇵🇭 Philippines | Asia | 1,982,333 |
| 🇸🇻 El Salvador | Latin America & Caribbean | 1,407,622 |
| 🇻🇳 Vietnam | Asia | 1,331,192 |
| 🇨🇺 Cuba | Latin America & Caribbean | 1,312,510 |
| 🇩🇴 Dominican Republic | Latin America & Caribbean | 1,279,900 |
| 🇬🇹 Guatemala | Latin America & Caribbean | 1,148,543 |
| 🇰🇷 Korea | Asia | 1,045,100 |
| 🇨🇴 Colombia | Latin America & Caribbean | 928,053 |
| 🇭🇳 Honduras | Latin America & Caribbean | 843,774 |
| 🇨🇦 Canada | Northern America | 821,322 |
| 🇯🇲 Jamaica | Latin America & Caribbean | 804,775 |
| 🇭🇹 Haiti | Latin America & Caribbean | 730,780 |
| 🇬🇧 United Kingdom | Europe | 676,652 |
| 🇻🇪 Venezuela | Latin America & Caribbean | 667,664 |
| 🇧🇷 Brazil | Latin America & Caribbean | 618,525 |
| 🇩🇪 Germany | Europe | 537,484 |
| 🇪🇨 Ecuador | Latin America & Caribbean | 518,287 |
| 🇵🇪 Peru | Latin America & Caribbean | 471,988 |
| 🇳🇬 Nigeria | Africa | 448,405 |
| 🇺🇦 Ukraine | Europe | 427,163 |
| 🇮🇷 Iran | Middle East | 407,283 |
| 🇵🇰 Pakistan | Asia | 399,086 |
| Rest of World | 11,637,634 | |
| Total | 46,182,089 |
Mexicans are followed in this ranking by Indians, Chinese, and Filipinos, though most immigrants on this list come from countries in the Latin American and Caribbean region.
On the other hand, only three European countries are among the top sources of U.S. immigrants: the UK, Germany, and Ukraine.
Immigration continues to be a significant factor contributing to the overall growth of the U.S. population. Overall population growth has decelerated over the past decade primarily due to declining birth rates.
Between 2021 and 2022, the increase in the immigrant population accounted for 65% of the total population growth in the U.S., representing 912,000 individuals out of nearly 1.4 million.
If you enjoyed this post, be sure to check out Visualized: Why Do People Immigrate to the U.S.? This visualization shows the different reasons cited by new arrivals to America in 2021.

-

 United States1 week ago
Mapped: Countries Where Recreational Cannabis is Legal
-

 Healthcare2 weeks ago
Life Expectancy by Region (1950-2050F)
-

 Markets2 weeks ago
The Growth of a $1,000 Equity Investment, by Stock Market
-

 Markets2 weeks ago
Mapped: Europe’s GDP Per Capita, by Country
-

 Money2 weeks ago
Charted: What Frustrates Americans About the Tax System
-

 Technology2 weeks ago
Countries With the Highest Rates of Crypto Ownership
-

 Mining2 weeks ago
Where the World’s Aluminum is Smelted, by Country
-

 Personal Finance2 weeks ago
Visualizing the Tax Burden of Every U.S. State