Mapped: Europe’s GDP Per Capita, by Country
The Growth of a $1,000 Equity Investment, by Stock Market
Mapped: The Most Valuable Company in Each Southeast Asian Country
Visualizing Global Inflation Forecasts (2024-2026)
The World’s Fastest Growing Emerging Markets (2024-2029 Forecast)
Countries With the Highest Rates of Crypto Ownership
Mapped: The Number of AI Startups By Country
All of the Grants Given by the U.S. CHIPS Act
Visualizing AI Patents by Country
How Tech Logos Have Evolved Over Time
Visualizing the Tax Burden of Every U.S. State
Charted: What Frustrates Americans About the Tax System
Ranked: The Top 20 Countries in Debt to China
Charted: Which Country Has the Most Billionaires in 2024?
Charted: Which City Has the Most Billionaires in 2024?
Mapped: Countries Where Recreational Cannabis is Legal
Which Countries Have the Highest Infant Mortality Rates?
Life Expectancy by Region (1950-2050F)
What Causes Preventable Child Deaths?
The Cost of an EpiPen in Major Markets
Who’s Building the Most Solar Energy?
Mapped: The Age of Energy Projects in Interconnection Queues, by State
Ranked: The Top 10 EV Battery Manufacturers in 2023
The World’s Biggest Nuclear Energy Producers
The World’s Biggest Oil Producers in 2023
Mapped: U.S. Immigrants by Region
Mapped: Southeast Asia’s GDP Per Capita, by Country
The Largest Earthquakes in the New York Area (1970-2024)
Mapped: Average Wages Across Europe
Visualizing Copper Production by Country in 2023
Where the World’s Aluminum is Smelted, by Country
Visualizing Global Gold Production in 2023
Gold vs. S&P 500: Which Has Grown More Over Five Years?
How People Get Around in America, Europe, and Asia
The Carbon Footprint of Major Travel Methods
Ranking the Top 15 Countries by Carbon Tax Revenue
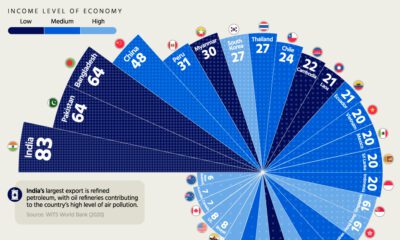
Ranked: The Countries With the Most Air Pollution in 2023
Top Countries By Forest Growth Since 2001
Which economies have hazy air, and which ones enjoy mostly clear skies? Find out in this geographic breakdown of air pollution levels.
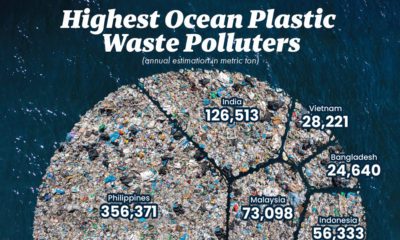
This graphic visualizes the top 10 countries emitting plastic pollutants into our oceans.
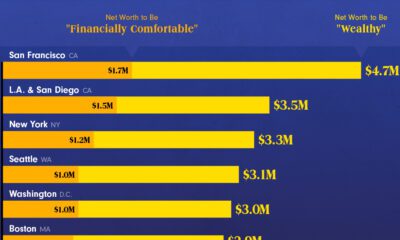
This graphic shows what it takes to be wealthy in America today—and how this can significantly shift based on the city you live in.
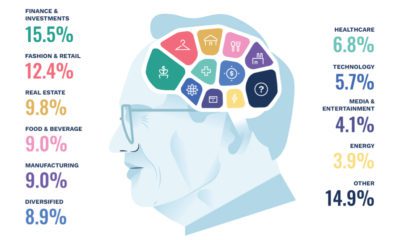
From Warren Buffett to Elon Musk, this graphic shows the world’s billionaires based on their top sectors, residence, and net worth.
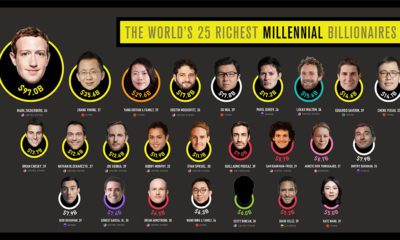
There are over 2,700 billionaires in the world, but how many are millennials? This visual breaks down the richest millennial billionaires.
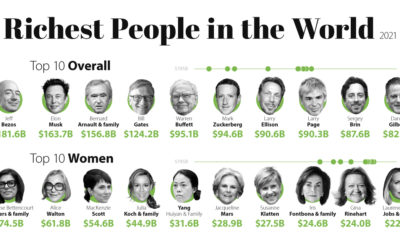
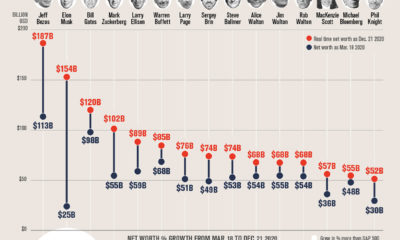
Among the uber-rich, just ten people amassed over $732 billion since the pandemic was declared. Who are the richest people in the world as of 2021?
The net worth of some American Billionaires has grown substantially since the COVID-19 market bottom. Here's how much their fortunes grew.
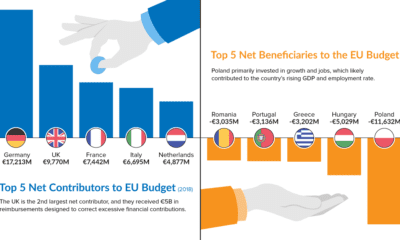
As Brexit looms, the EU budget is under the microscope. Learn which countries contribute the most—and least—to the bottom line in this chart.
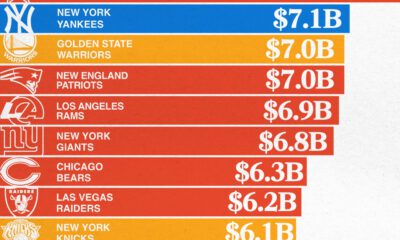
The most valuable sports teams in 2024 range from NBA and MLB teams to renowned soccer clubs in Europe, but the NFL reigned supreme.
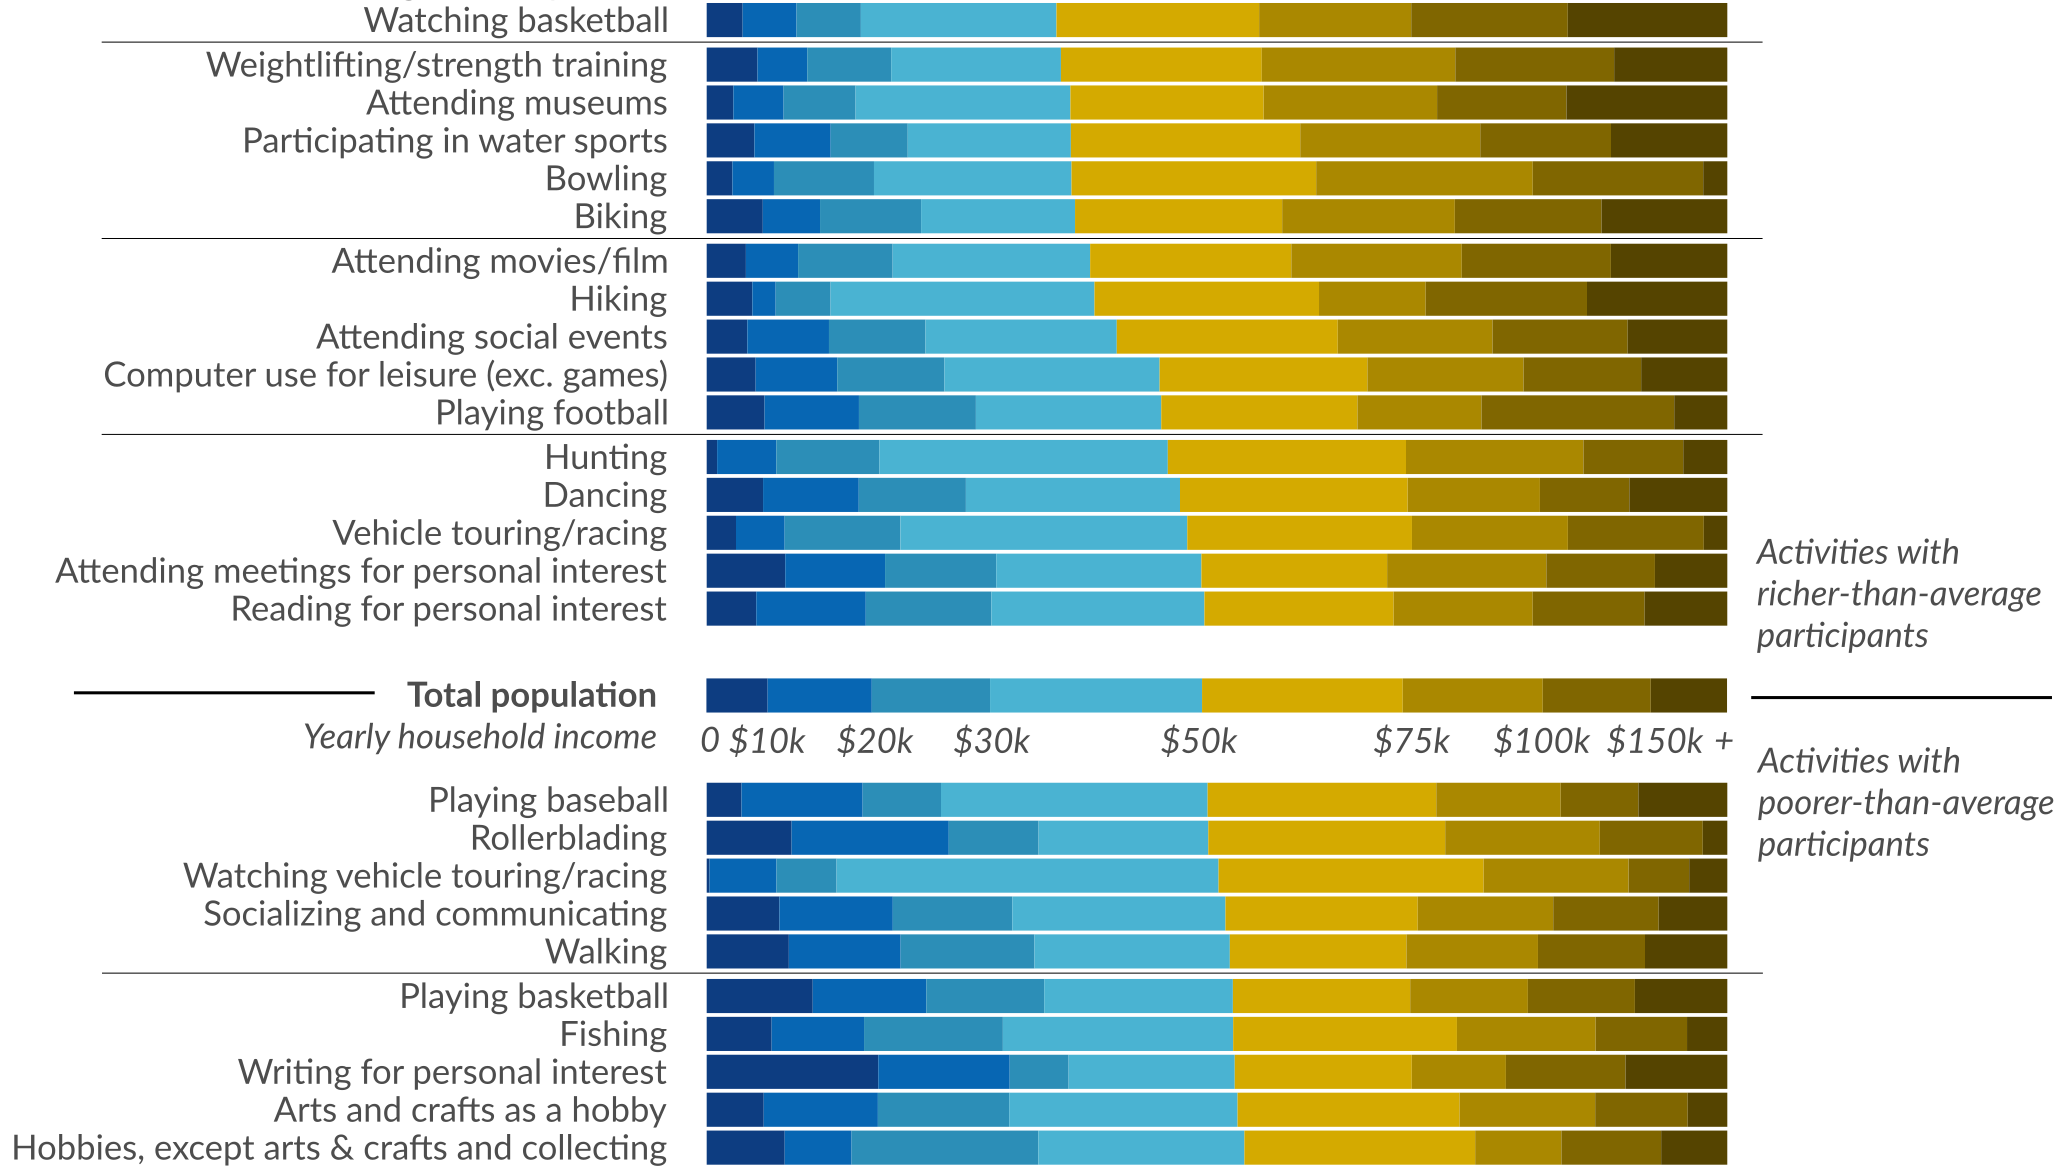
Ever wonder how people spend time? This data visualization shows favorite American past-times like playing baseball or watching TV by using income brackets.


 Creator Program