Mapped: Europe’s GDP Per Capita, by Country
The Growth of a $1,000 Equity Investment, by Stock Market
Mapped: The Most Valuable Company in Each Southeast Asian Country
Visualizing Global Inflation Forecasts (2024-2026)
The World’s Fastest Growing Emerging Markets (2024-2029 Forecast)
Countries With the Highest Rates of Crypto Ownership
Mapped: The Number of AI Startups By Country
All of the Grants Given by the U.S. CHIPS Act
Visualizing AI Patents by Country
How Tech Logos Have Evolved Over Time
Visualizing the Tax Burden of Every U.S. State
Charted: What Frustrates Americans About the Tax System
Ranked: The Top 20 Countries in Debt to China
Charted: Which Country Has the Most Billionaires in 2024?
Charted: Which City Has the Most Billionaires in 2024?
Which Countries Have the Highest Infant Mortality Rates?
Life Expectancy by Region (1950-2050F)
What Causes Preventable Child Deaths?
The Cost of an EpiPen in Major Markets
Charted: Global Tobacco Use by Country and Sex
Who’s Building the Most Solar Energy?
Mapped: The Age of Energy Projects in Interconnection Queues, by State
Ranked: The Top 10 EV Battery Manufacturers in 2023
The World’s Biggest Nuclear Energy Producers
The World’s Biggest Oil Producers in 2023
Mapped: U.S. Immigrants by Region
Mapped: Southeast Asia’s GDP Per Capita, by Country
The Largest Earthquakes in the New York Area (1970-2024)
Mapped: Average Wages Across Europe
Mapped: Asia’s Population Patterns by Density
Visualizing Copper Production by Country in 2023
Where the World’s Aluminum is Smelted, by Country
Visualizing Global Gold Production in 2023
Gold vs. S&P 500: Which Has Grown More Over Five Years?
How People Get Around in America, Europe, and Asia
The Carbon Footprint of Major Travel Methods
Ranking the Top 15 Countries by Carbon Tax Revenue
Ranked: The Countries With the Most Air Pollution in 2023
Top Countries By Forest Growth Since 2001
A collection of the best Warren Buffett quotes, accompanied with illustrations, to close out our infographic series on the famous investor.
We round up the most popular, most discussed, and most liked visualizations of the month on Voronoi, our new data storytelling platform.
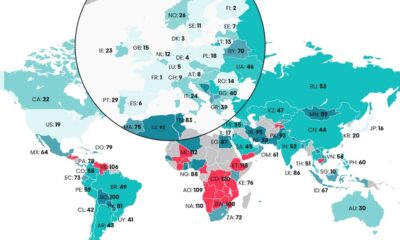
The Digital Quality of Life Index shows which countries are doing a better job than others in providing accessible and affordable internet.
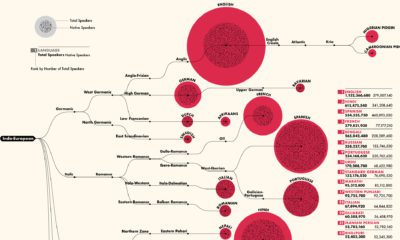
This detailed visualization breaks down the 100 most spoken languages around the world, by total and native speakers. Can you find yours on the list?
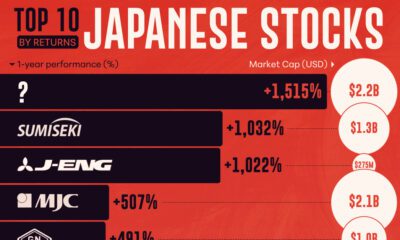
With the Nikkei 225 hitting its first all-time high since 1989, we've ranked the top 10 Japanese stocks by their 1-yr return.
Jin Medical, the top IPO of the year, is set to be delisted due to a listing rule violation.
The markets in 2022 were characterized by a lot more pain than gain. That said, there were winners to be found, even during a turbulent year
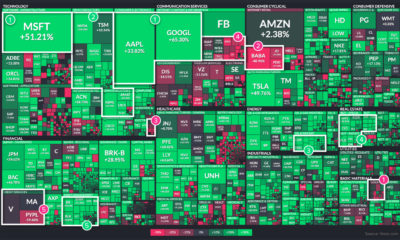
2021 was yet another tumultuous year. Which stock market sectors thrived during the twists and turns of the last 12 months, and which faltered?
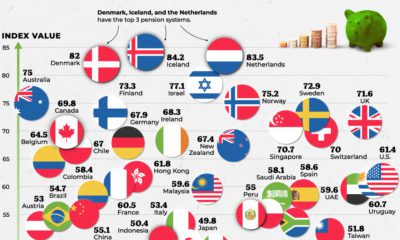
Which countries are best equipped to support their elderly citizens? This graphic compares pension plans around the world.
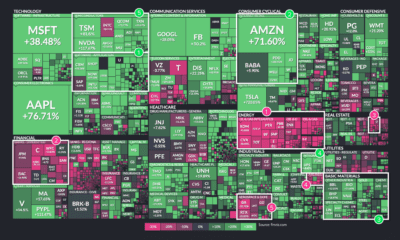
This treemap visualization shows the best and worst performing sectors of the stock market in 2020. We break down the winners and losers.


 Creator Program