Top 10 Countries Most in Debt to the IMF
Ranked: The Top 6 Economies by Share of Global GDP (1980-2024)
Mapped: Europe’s GDP Per Capita, by Country
The Growth of a $1,000 Equity Investment, by Stock Market
Mapped: The Most Valuable Company in Each Southeast Asian Country
Countries With the Highest Rates of Crypto Ownership
Mapped: The Number of AI Startups By Country
All of the Grants Given by the U.S. CHIPS Act
Visualizing AI Patents by Country
How Tech Logos Have Evolved Over Time
Visualizing America’s Average Retirement Savings, by Age
Visualizing the Tax Burden of Every U.S. State
Charted: What Frustrates Americans About the Tax System
Ranked: The Top 20 Countries in Debt to China
Mapped: Countries Where Recreational Cannabis is Legal
Which Countries Have the Highest Infant Mortality Rates?
Life Expectancy by Region (1950-2050F)
What Causes Preventable Child Deaths?
The Cost of an EpiPen in Major Markets
Who’s Building the Most Solar Energy?
Mapped: The Age of Energy Projects in Interconnection Queues, by State
Ranked: The Top 10 EV Battery Manufacturers in 2023
The World’s Biggest Nuclear Energy Producers
The World’s Biggest Oil Producers in 2023
Mapped: U.S. States By Number of Cities Over 250,000 Residents
Mapped: U.S. Immigrants by Region
Mapped: Southeast Asia’s GDP Per Capita, by Country
The Largest Earthquakes in the New York Area (1970-2024)
The Biggest Salt Producing Countries in 2023
Visualizing Copper Production by Country in 2023
Where the World’s Aluminum is Smelted, by Country
Visualizing Global Gold Production in 2023
How People Get Around in America, Europe, and Asia
The Carbon Footprint of Major Travel Methods
Ranking the Top 15 Countries by Carbon Tax Revenue
Ranked: The Countries With the Most Air Pollution in 2023
Top Countries By Forest Growth Since 2001
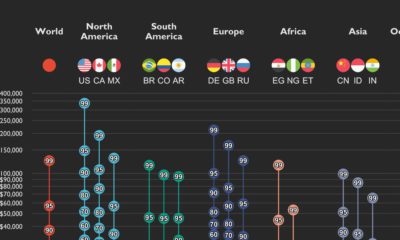
This graphic shows income distributions in 16 different countries around the world, using data from the World Inequality Database.
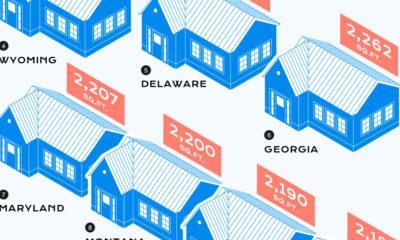
Over the last century, the median home size in the U.S. has skyrocketed. Here’s a look at which states have the biggest and smallest homes.
This graphic shows the 32 teams that will be playing in the 2022 FIFA World Cup, and breaks down the groups and each team's World Ranking
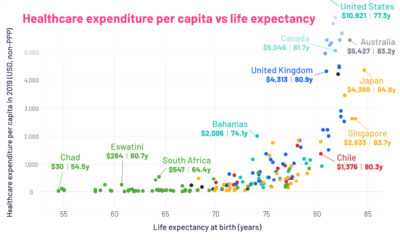
This graphic looks at average life expectancies in countries around the world, compared to each country's healthcare spending per capita.
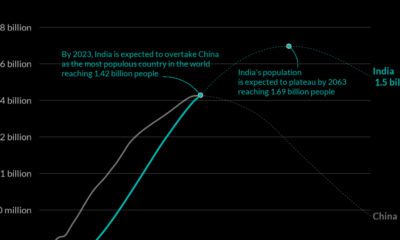
India's population growth is happening faster than predicted. The country will overtake China as the world’s most populated country in 2023.
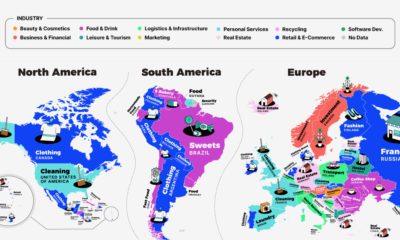
This series of maps shows a regional breakdown of the most popular types of businesses people want to start, based on online search results.
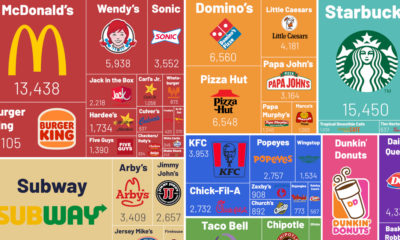
Here’s a look at the most popular fast food chains in the U.S., based on their number of stores as of 2021.
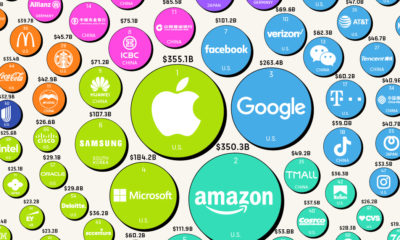
A strong brand is extremely lucrative when leveraged properly. Here's a look at the most valuable brands in 2022, according to Brand Finance.
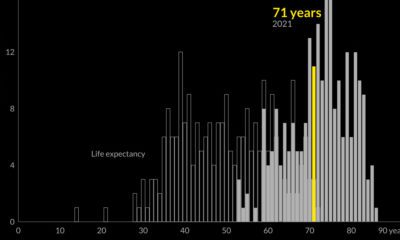
Global life expectancy has been increasing worldwide over the last 70 years. But how does the picture break down by region and by sex?
This detailed map highlights 200+ celestial objects that astronomers have discovered about our universe and provides facts about each one.


 Creator Program