Mapped: Europe’s GDP Per Capita, by Country
The Growth of a $1,000 Equity Investment, by Stock Market
Mapped: The Most Valuable Company in Each Southeast Asian Country
Visualizing Global Inflation Forecasts (2024-2026)
The World’s Fastest Growing Emerging Markets (2024-2029 Forecast)
Countries With the Highest Rates of Crypto Ownership
Mapped: The Number of AI Startups By Country
All of the Grants Given by the U.S. CHIPS Act
Visualizing AI Patents by Country
How Tech Logos Have Evolved Over Time
Visualizing the Tax Burden of Every U.S. State
Charted: What Frustrates Americans About the Tax System
Ranked: The Top 20 Countries in Debt to China
Charted: Which Country Has the Most Billionaires in 2024?
Charted: Which City Has the Most Billionaires in 2024?
Mapped: Countries Where Recreational Cannabis is Legal
Which Countries Have the Highest Infant Mortality Rates?
Life Expectancy by Region (1950-2050F)
What Causes Preventable Child Deaths?
The Cost of an EpiPen in Major Markets
Who’s Building the Most Solar Energy?
Mapped: The Age of Energy Projects in Interconnection Queues, by State
Ranked: The Top 10 EV Battery Manufacturers in 2023
The World’s Biggest Nuclear Energy Producers
The World’s Biggest Oil Producers in 2023
Mapped: U.S. Immigrants by Region
Mapped: Southeast Asia’s GDP Per Capita, by Country
The Largest Earthquakes in the New York Area (1970-2024)
Mapped: Average Wages Across Europe
Visualizing Copper Production by Country in 2023
Where the World’s Aluminum is Smelted, by Country
Visualizing Global Gold Production in 2023
Gold vs. S&P 500: Which Has Grown More Over Five Years?
How People Get Around in America, Europe, and Asia
The Carbon Footprint of Major Travel Methods
Ranking the Top 15 Countries by Carbon Tax Revenue
Ranked: The Countries With the Most Air Pollution in 2023
Top Countries By Forest Growth Since 2001
The history of Europe is breathtakingly complex, but this animation helps makes sense of 2,400 years of change on the European map.
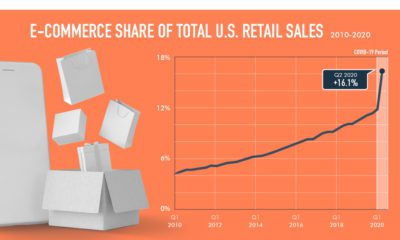
E-commerce is already massive, but COVID-19 has proven to be an unexpected catalyst in driving the use of digital marketplaces.
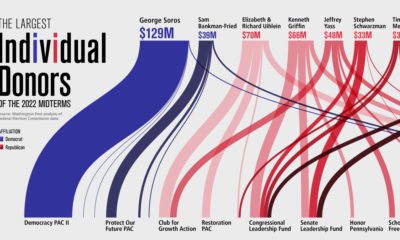
A record-smashing $9 billion has been raised for the 2022 midterm elections. See who the top 10 donors are in this graphic.
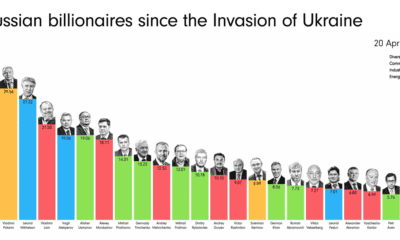
How have Russian billionaires fared since Russia's invasion of Ukraine? This animation tracks the wealth of 22 Russian billionaires.
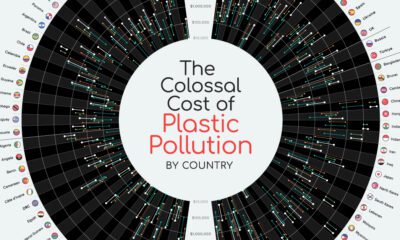
The environmental impact of the combined 139M tons of plastic pollution in oceans and rivers is well known, but what about the economic cost?
In 2022, the global net assets of mutual fund and ETF providers totaled $38 trillion. This chart shows the industry's biggest brands.
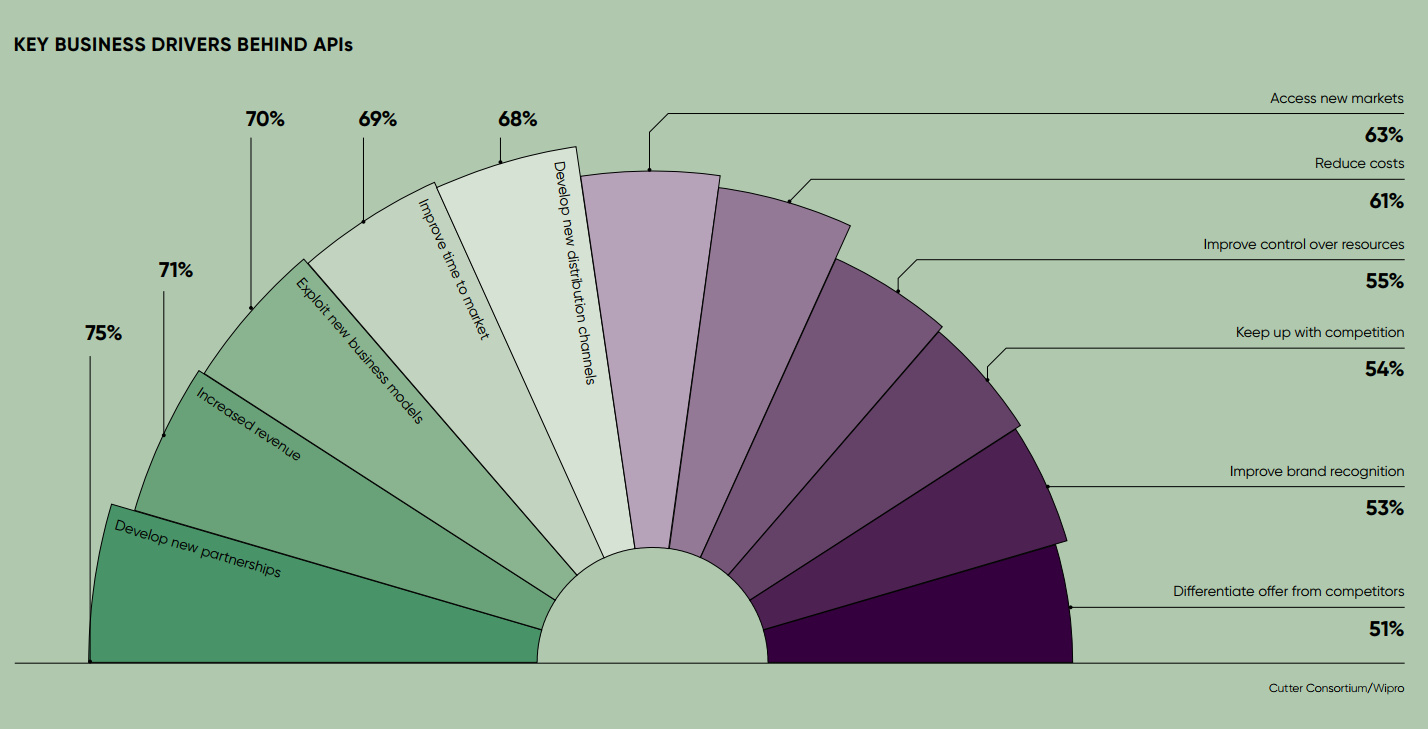
From searching flight deals to checking the weather, we rely on connected digital platforms in many ways. APIs work behind the scenes to make it all...
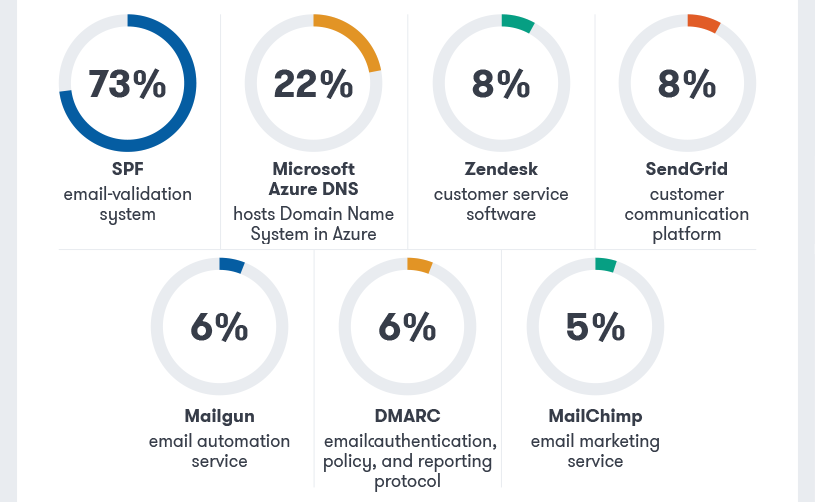
Ever wonder what technologies are used by the upstart companies that dominate the Inc. 5000 list? See what powers their growth in this infographic.
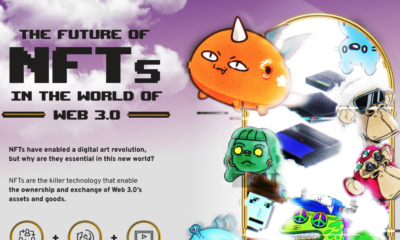
NFTs are revolutionizing digital asset ownership and laying the foundations for play-to-earn games, the metaverse economy, and more.
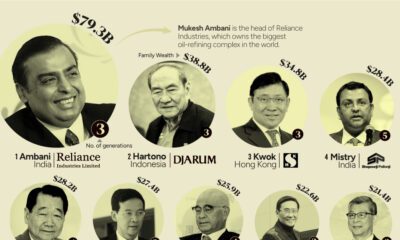
This graphic shows the 15 richest families in Asia. From energy to banking, these dynasties have built fortunes across many sectors.


 Creator Program