Mapped: Europe’s GDP Per Capita, by Country
The Growth of a $1,000 Equity Investment, by Stock Market
Mapped: The Most Valuable Company in Each Southeast Asian Country
Visualizing Global Inflation Forecasts (2024-2026)
The World’s Fastest Growing Emerging Markets (2024-2029 Forecast)
Countries With the Highest Rates of Crypto Ownership
Mapped: The Number of AI Startups By Country
All of the Grants Given by the U.S. CHIPS Act
Visualizing AI Patents by Country
How Tech Logos Have Evolved Over Time
Visualizing the Tax Burden of Every U.S. State
Charted: What Frustrates Americans About the Tax System
Ranked: The Top 20 Countries in Debt to China
Charted: Which Country Has the Most Billionaires in 2024?
Charted: Which City Has the Most Billionaires in 2024?
Mapped: Countries Where Recreational Cannabis is Legal
Which Countries Have the Highest Infant Mortality Rates?
Life Expectancy by Region (1950-2050F)
What Causes Preventable Child Deaths?
The Cost of an EpiPen in Major Markets
Who’s Building the Most Solar Energy?
Mapped: The Age of Energy Projects in Interconnection Queues, by State
Ranked: The Top 10 EV Battery Manufacturers in 2023
The World’s Biggest Nuclear Energy Producers
The World’s Biggest Oil Producers in 2023
Mapped: U.S. Immigrants by Region
Mapped: Southeast Asia’s GDP Per Capita, by Country
The Largest Earthquakes in the New York Area (1970-2024)
Mapped: Average Wages Across Europe
Visualizing Copper Production by Country in 2023
Where the World’s Aluminum is Smelted, by Country
Visualizing Global Gold Production in 2023
Gold vs. S&P 500: Which Has Grown More Over Five Years?
How People Get Around in America, Europe, and Asia
The Carbon Footprint of Major Travel Methods
Ranking the Top 15 Countries by Carbon Tax Revenue
Ranked: The Countries With the Most Air Pollution in 2023
Top Countries By Forest Growth Since 2001
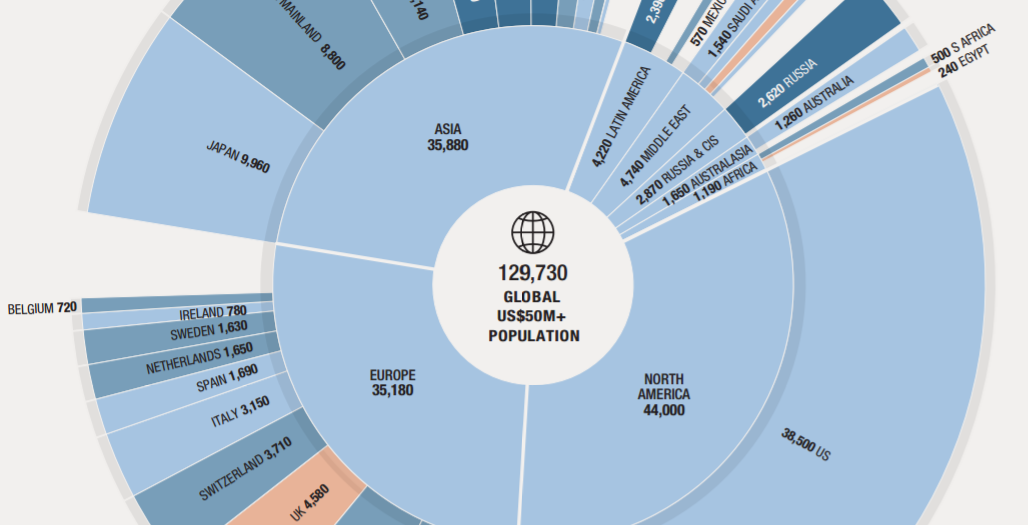
This nifty visualization from Knight Frank breaks down the world's population of ultra-wealthy ($50mm+) people by country and region.
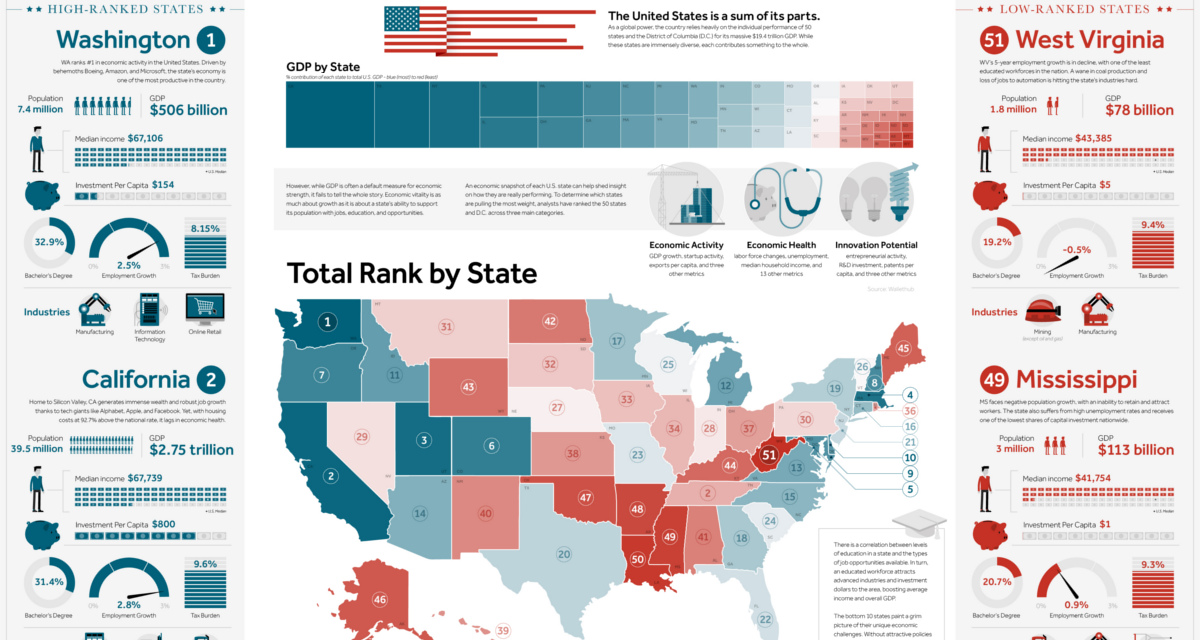
This giant infographic has state economies ranked from best to worst, based on an overall score comprised of 27 different metrics.
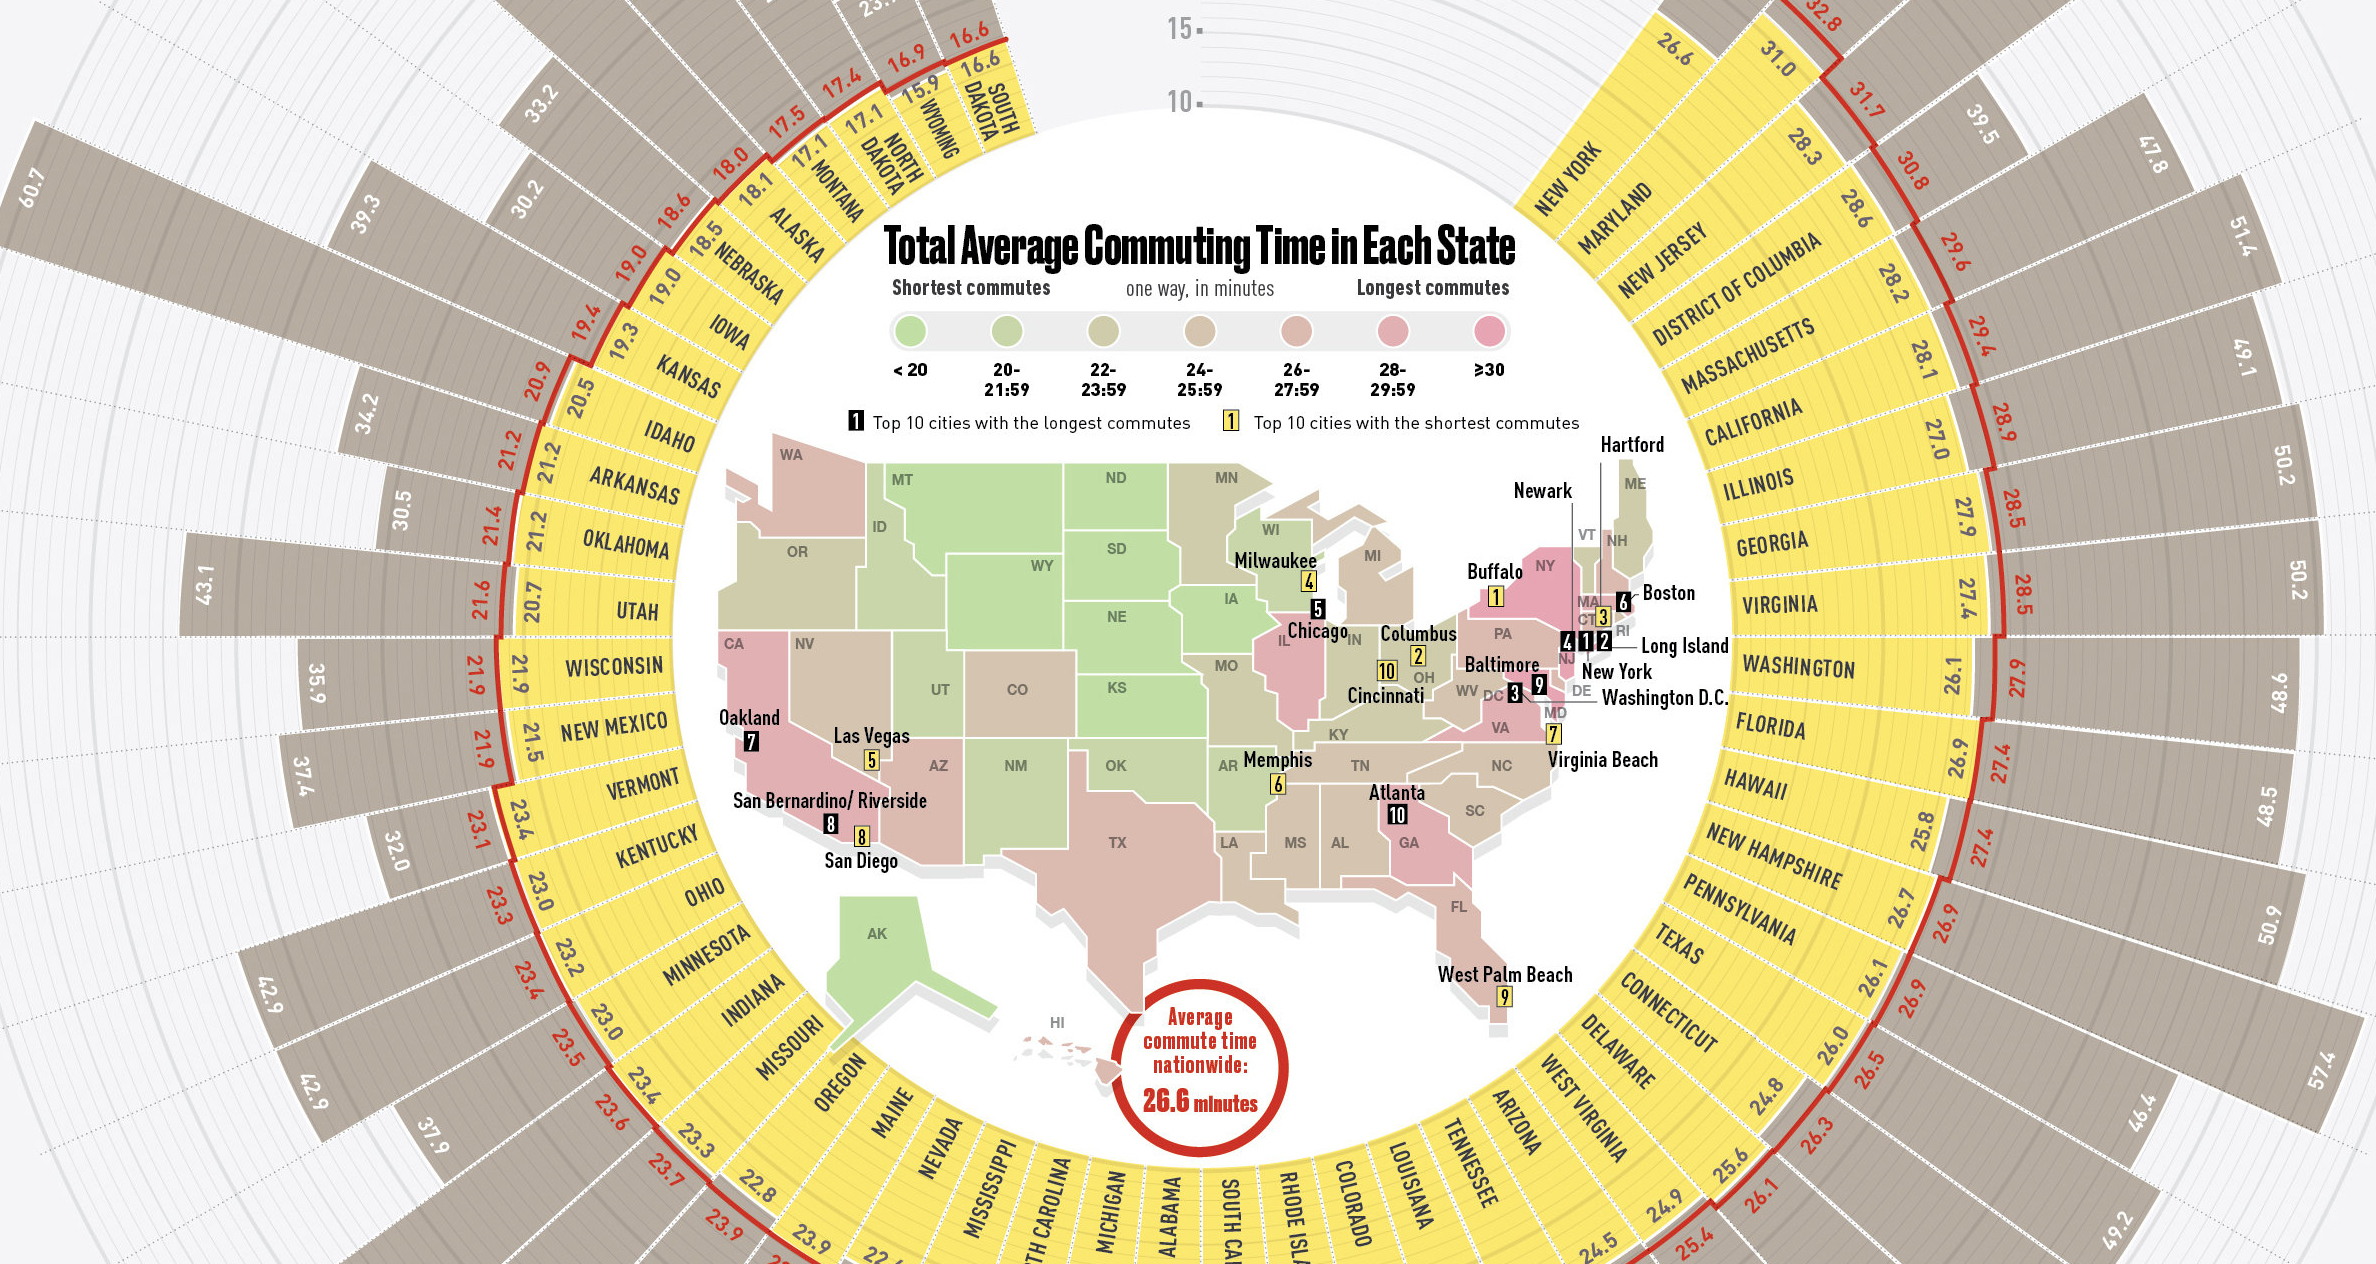
This infographic compares all U.S. states by average commute time, while also listing the top 10 cities with the longest and shortest commutes in the country.
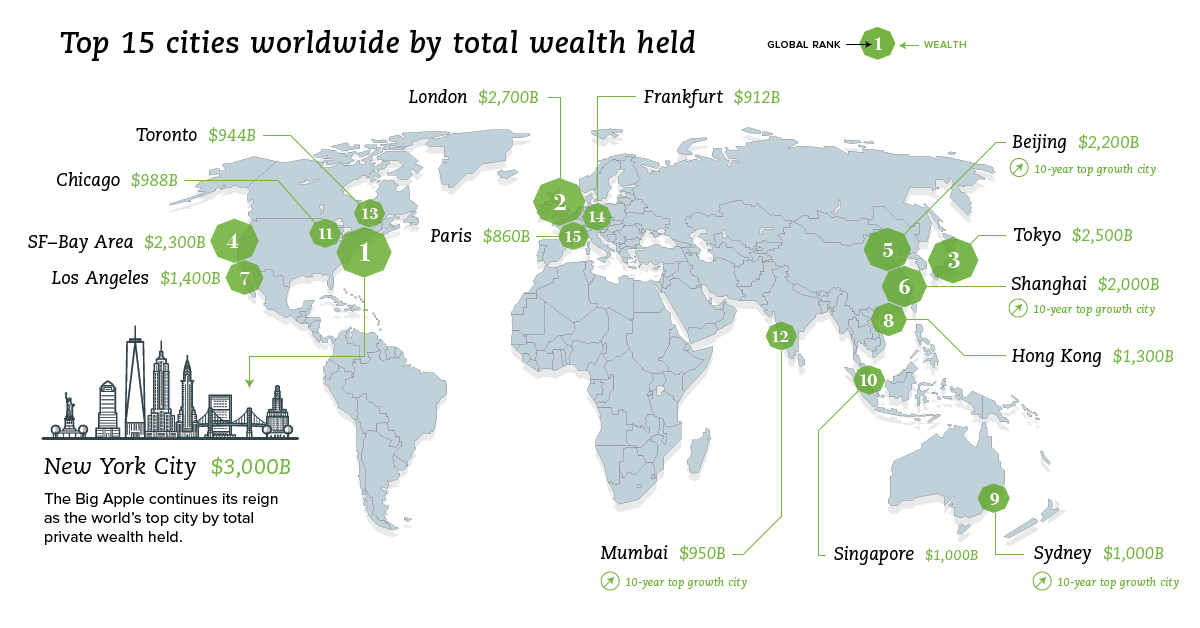
What are the world's wealthiest cities, and what portion of global wealth is located in each of these key urban centers?
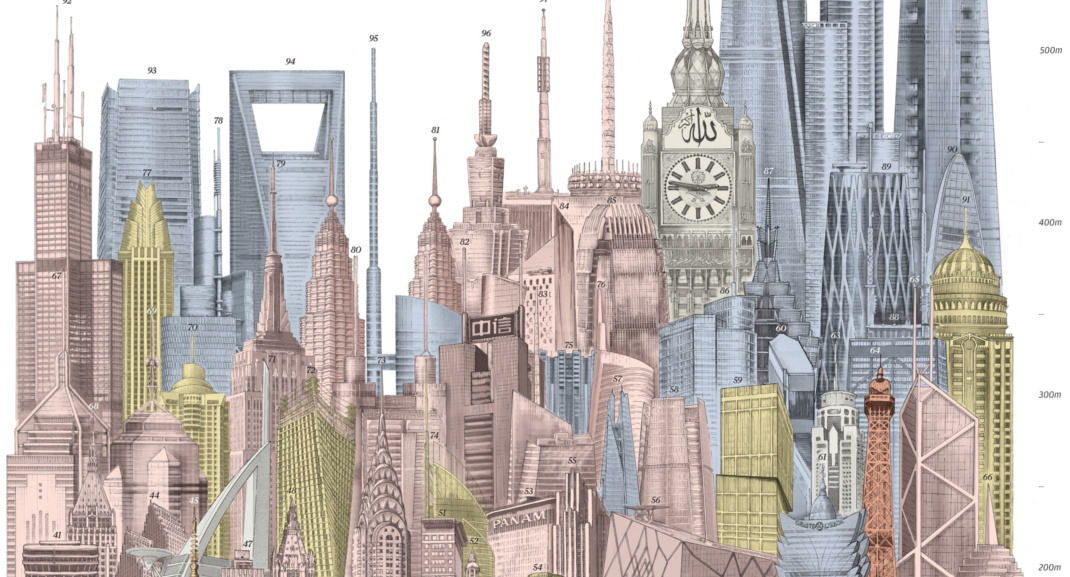
Today's visualization demonstrates the mind-bending scale of the newest generation of megatall skyscrapers. The stage is set for a global skyscraper boom.
Nickel is the most important metal by mass in lithium-ion batteries, and its role is only increasing going forward.
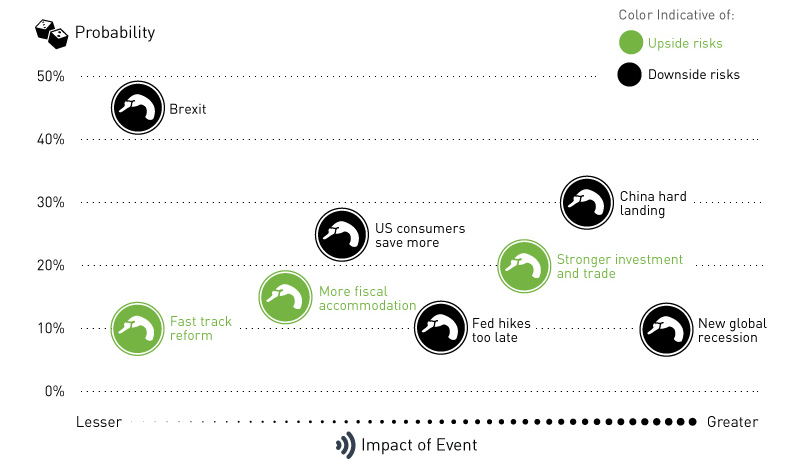
What possible events are adding upside and downside risks to the market? We chart SocGen's latest black swan list as we edge towards 2016.
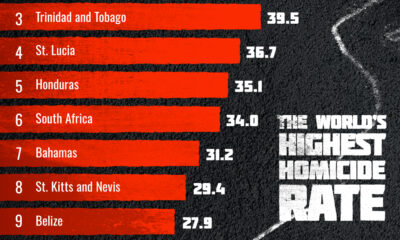
This graphic shows the top 10 most dangerous countries in the world, based on homicide rates per 100,000 people.
China holds the position of both the top importer and exporter with MENA countries by volume.
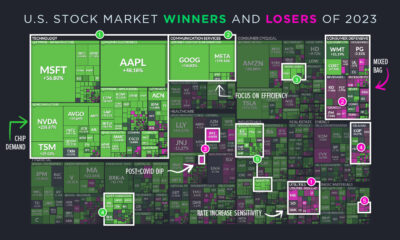
Here are the best performing sectors of 2023—and the ones that fell behind—in a year defined by AI, high interest rates, and resilience.