Technology
Ranked: The Most Innovative Countries in 2023


The Most Innovative Countries in the World in 2023
Which countries are the global innovation powerhouses?
In many ways, the past year has represented an inflection point in technological advancement. Almost overnight, OpenAI’s large language model ChatGPT became a household name and AI was within reach to the masses.
Yet looking under the surface, innovation is influenced by several unseen factors, from the institutional environment and high-tech exports to research talent and entrepreneurship culture.
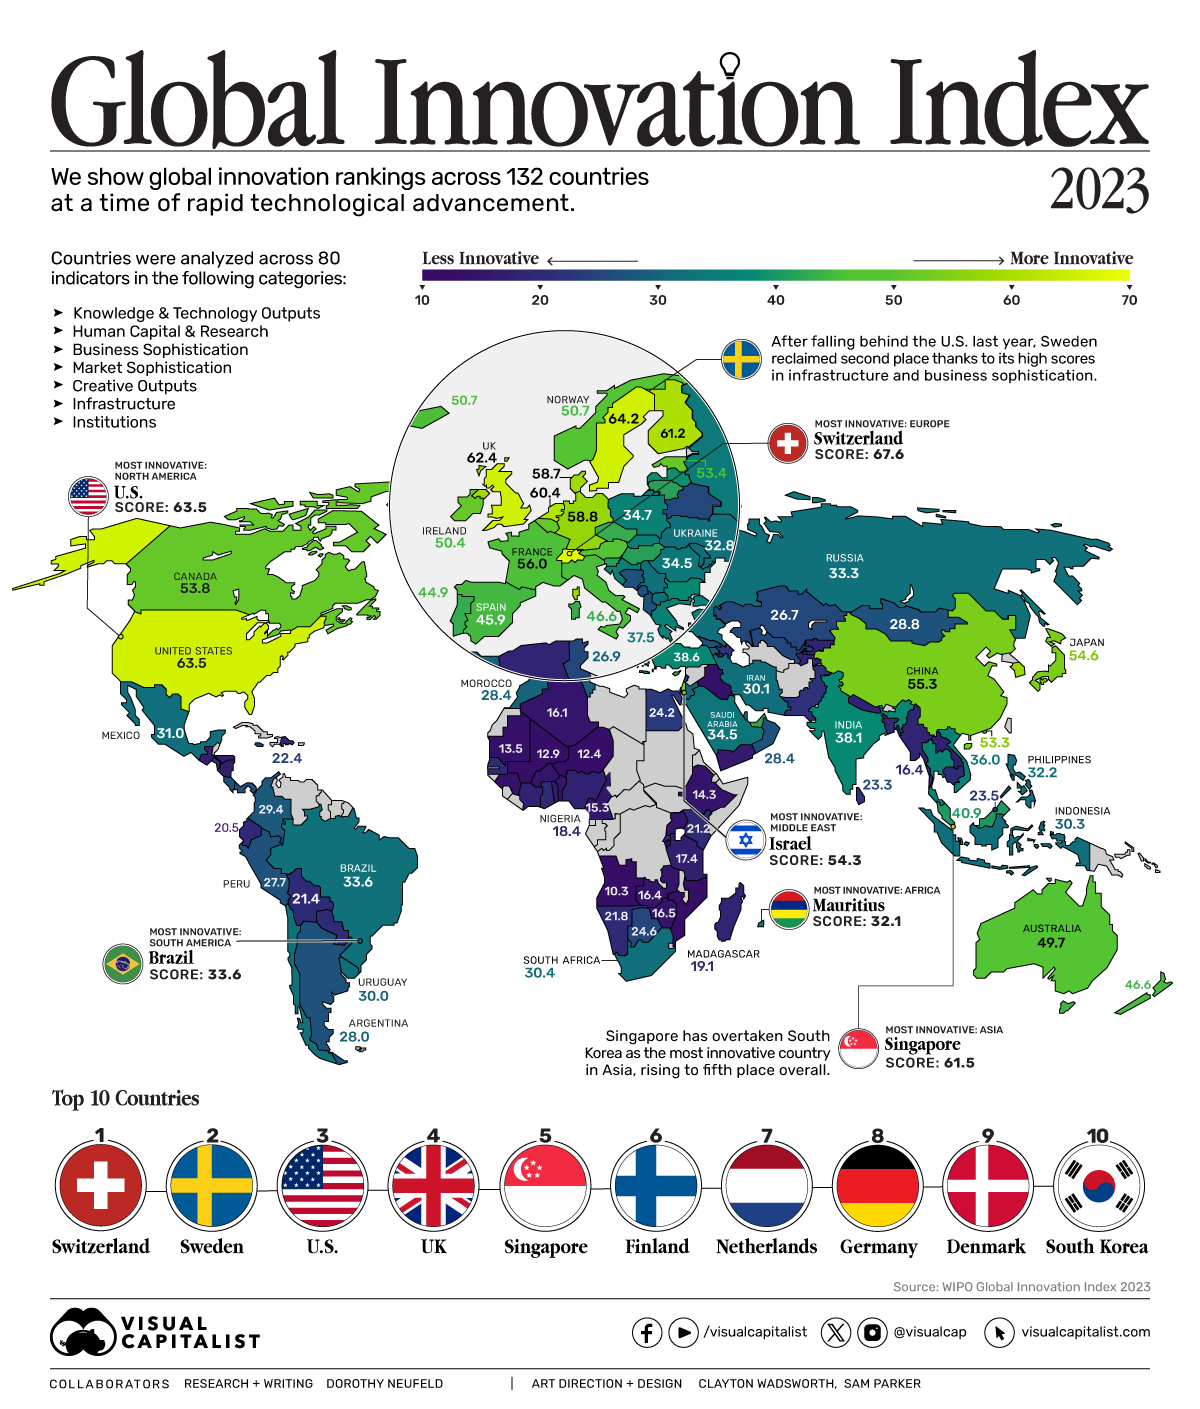
This graphic shows the most innovative countries in the world, based on the 2023 Global Innovation Index (GII) put together by the World Intellectual Property Organization.
How is Innovation Measured?
The GII framework uses seven pillars and 80 indicators to assess a country’s innovative strength:
| Innovation Pillar | Example Indicators |
|---|---|
| 👨💻 Knowledge & Tech Outputs | Patent applications, Hi-tech manufacturing |
| 👩🏫 Human Capital & Research | Researchers per million population, Global corporate R&D investors |
| 🧳 Business Sophistication | Knowledge-intensive employment, University-industry R&D collaboration |
| 📈 Market Sophistication | Finance for startups, Venture capital received |
| 💡 Creative Outputs | Trademark applications, Global brand value |
| 🛣️ Infrastructure | Environmental performance, Information and communication technology access |
| 🏛️ Institutions | Regulatory quality, Policies for doing business |
Together, the sum of these pillars produces an overall score for each country.
Most Innovative Countries in 2023
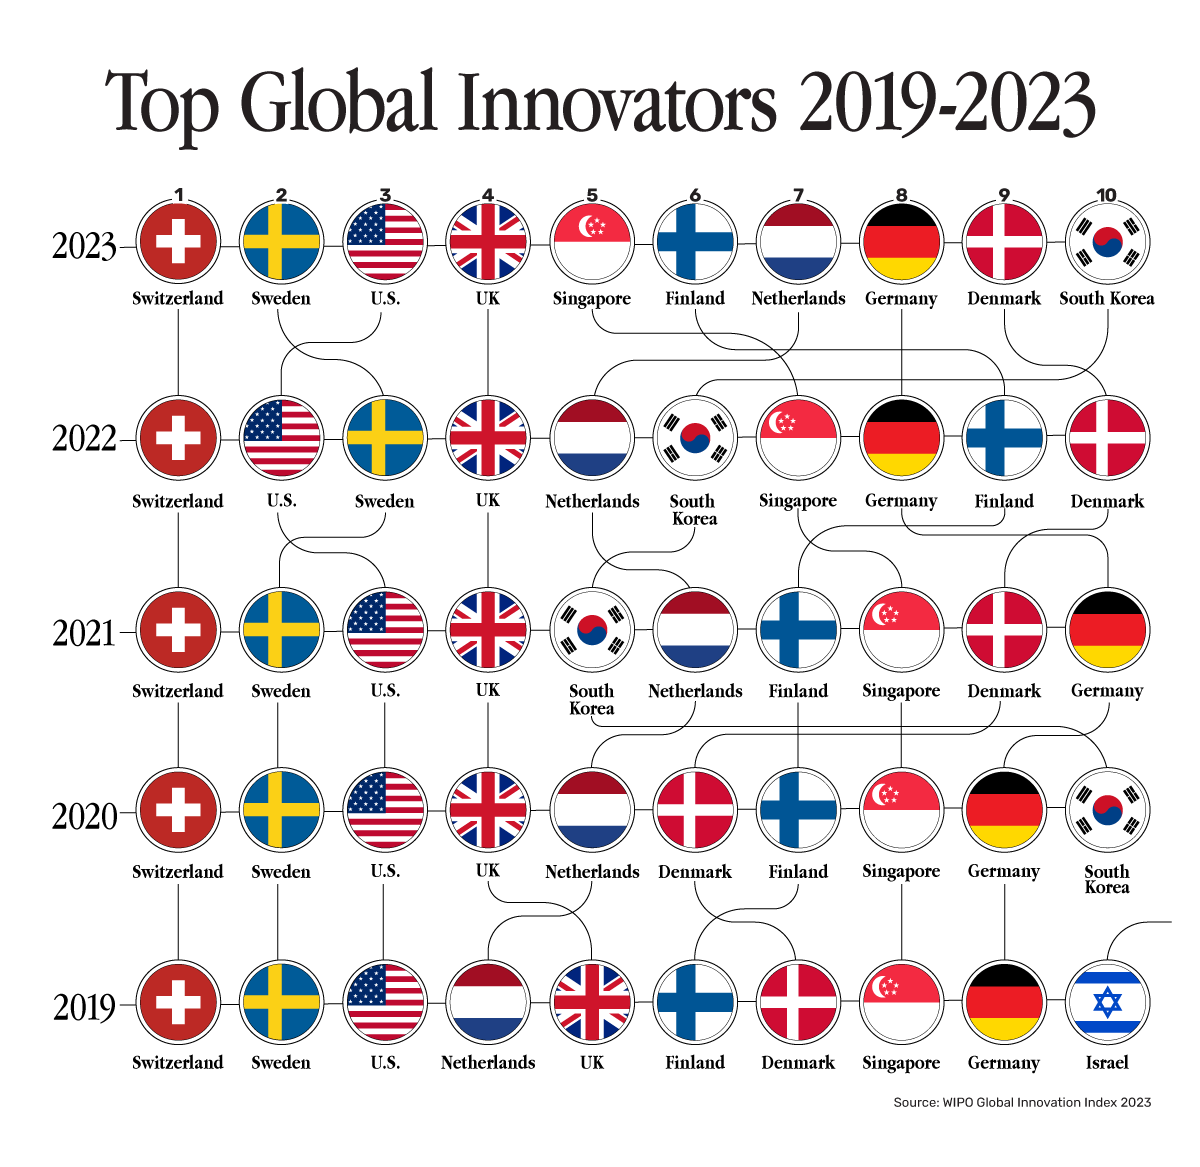
For the 13th consecutive year, Switzerland was named the world’s most innovative country.
Among the key factors underscoring its rank are its policies for doing business and its scale of patent applications. Its world-class research institutions and skilled workforce are also key ingredients in fostering innovation.
Below, we show the most innovative countries in 2023 across 132 economies:
| Rank | Country | Score |
|---|---|---|
| 1 | 🇨🇭 Switzerland | 67.6 |
| 2 | 🇸🇪 Sweden | 64.2 |
| 3 | 🇺🇸 U.S. | 63.5 |
| 4 | 🇬🇧 UK | 62.4 |
| 5 | 🇸🇬 Singapore | 61.5 |
| 6 | 🇫🇮 Finland | 61.2 |
| 7 | 🇳🇱 Netherlands | 60.4 |
| 8 | 🇩🇪 Germany | 58.8 |
| 9 | 🇩🇰 Denmark | 58.7 |
| 10 | 🇰🇷 South Korea | 58.6 |
| 11 | 🇫🇷 France | 56.0 |
| 12 | 🇨🇳 China | 55.3 |
| 13 | 🇯🇵 Japan | 54.6 |
| 14 | 🇮🇱 Israel | 54.3 |
| 15 | 🇨🇦 Canada | 53.8 |
| 16 | 🇪🇪 Estonia | 53.4 |
| 17 | 🇭🇰 Hong Kong SAR | 53.3 |
| 18 | 🇦🇹 Austria | 53.2 |
| 19 | 🇳🇴 Norway | 50.7 |
| 20 | 🇮🇸 Iceland | 50.7 |
| 21 | 🇱🇺 Luxembourg | 50.6 |
| 22 | 🇮🇪 Ireland | 50.4 |
| 23 | 🇧🇪 Belgium | 49.9 |
| 24 | 🇦🇺 Australia | 49.7 |
| 25 | 🇲🇹 Malta | 49.1 |
| 26 | 🇮🇹 Italy | 46.6 |
| 27 | 🇳🇿 New Zealand | 46.6 |
| 28 | 🇨🇾 Cyprus | 46.3 |
| 29 | 🇪🇸 Spain | 45.9 |
| 30 | 🇵🇹 Portugal | 44.9 |
| 31 | 🇨🇿 Czech Republic | 44.8 |
| 32 | 🇦🇪 UAE | 43.2 |
| 33 | 🇸🇮 Slovenia | 42.2 |
| 34 | 🇱🇹 Lithuania | 42.0 |
| 35 | 🇭🇺 Hungary | 41.3 |
| 36 | 🇲🇾 Malaysia | 40.9 |
| 37 | 🇱🇻 Latvia | 39.7 |
| 38 | 🇧🇬 Bulgaria | 39.0 |
| 39 | 🇹🇷 Türkiye | 38.6 |
| 40 | 🇮🇳 India | 38.1 |
| 41 | 🇵🇱 Poland | 37.7 |
| 42 | 🇬🇷 Greece | 37.5 |
| 43 | 🇹🇭 Thailand | 37.1 |
| 44 | 🇭🇷 Croatia | 37.1 |
| 45 | 🇸🇰 Slovakia | 36.2 |
| 46 | 🇻🇳 Vietnam | 36.0 |
| 47 | 🇷🇴 Romania | 34.7 |
| 48 | 🇸🇦 Saudi Arabia | 34.5 |
| 49 | 🇧🇷 Brazil | 33.6 |
| 50 | 🇶🇦 Qatar | 33.4 |
| 51 | 🇷🇺 Russia | 33.3 |
| 52 | 🇨🇱 Chile | 33.3 |
| 53 | 🇷🇸 Serbia | 33.1 |
| 54 | 🇲🇰 North Macedonia | 33.0 |
| 55 | 🇺🇦 Ukraine | 32.8 |
| 56 | 🇵🇭 Philippines | 32.2 |
| 57 | 🇲🇺 Mauritius | 32.1 |
| 58 | 🇲🇽 Mexico | 31.0 |
| 59 | 🇿🇦 South Africa | 30.4 |
| 60 | 🇲🇩 Moldova | 30.3 |
| 61 | 🇮🇩 Indonesia | 30.3 |
| 62 | 🇮🇷 Iran | 30.1 |
| 63 | 🇺🇾 Uruguay | 30.0 |
| 64 | 🇰🇼 Kuwait | 29.9 |
| 65 | 🇬🇪 Georgia | 29.9 |
| 66 | 🇨🇴 Colombia | 29.4 |
| 67 | 🇧🇭 Bahrain | 29.1 |
| 68 | 🇲🇳 Mongolia | 28.8 |
| 69 | 🇴🇲 Oman | 28.4 |
| 70 | 🇲🇦 Morocco | 28.4 |
| 71 | 🇯🇴 Jordan | 28.2 |
| 72 | 🇦🇲 Armenia | 28.0 |
| 73 | 🇦🇷 Argentina | 28.0 |
| 74 | 🇨🇷 Costa Rica | 27.9 |
| 75 | 🇲🇪 Montenegro | 27.8 |
| 76 | 🇵🇪 Peru | 27.7 |
| 77 | 🇧🇦 Bosnia and Herzegovina | 27.1 |
| 78 | 🇯🇲 Jamaica | 27.1 |
| 79 | 🇹🇳 Tunisia | 26.9 |
| 80 | 🇧🇾 Belarus | 26.8 |
| 81 | 🇰🇿 Kazakhstan | 26.7 |
| 82 | 🇺🇿 Uzbekistan | 26.2 |
| 83 | 🇦🇱 Albania | 25.4 |
| 84 | 🇵🇦 Panama | 25.3 |
| 85 | 🇧🇼 Botswana | 24.6 |
| 86 | 🇪🇬 Egypt | 24.2 |
| 87 | 🇧🇳 Brunei | 23.5 |
| 88 | 🇵🇰 Pakistan | 23.3 |
| 89 | 🇦🇿 Azerbaijan | 23.3 |
| 90 | 🇱🇰 Sri Lanka | 23.3 |
| 91 | 🇨🇻 Cabo Verde | 23.3 |
| 92 | 🇱🇧 Lebanon | 23.2 |
| 93 | 🇸🇳 Senegal | 22.5 |
| 94 | 🇩🇴 Dominican Republic | 22.4 |
| 95 | 🇸🇻 El Salvador | 21.8 |
| 96 | 🇳🇦 Namibia | 21.8 |
| 97 | 🇧🇴 Bolivia | 21.4 |
| 98 | 🇵🇾 Paraguay | 21.4 |
| 99 | 🇬🇭 Ghana | 21.3 |
| 100 | 🇰🇪 Kenya | 21.2 |
| 101 | 🇰🇭 Cambodia | 20.8 |
| 102 | 🇹🇹 Trinidad and Tobago | 20.7 |
| 103 | 🇷🇼 Rwanda | 20.6 |
| 104 | 🇪🇨 Ecuador | 20.5 |
| 105 | 🇧🇩 Bangladesh | 20.2 |
| 106 | 🇰🇬 Kyrgyzstan | 20.2 |
| 107 | 🇲🇬 Madagascar | 19.1 |
| 108 | 🇳🇵 Nepal | 18.8 |
| 109 | 🇳🇬 Nigeria | 18.4 |
| 110 | 🇱🇦 Laos | 18.3 |
| 111 | 🇹🇯 Tajikistan | 18.3 |
| 112 | 🇨🇮 Côte d’Ivoire | 18.2 |
| 113 | 🇹🇿 Tanzania | 17.4 |
| 114 | 🇹🇬 Togo | 16.9 |
| 115 | 🇳🇮 Nicaragua | 16.9 |
| 116 | 🇭🇳 Honduras | 16.7 |
| 117 | 🇿🇼 Zimbabwe | 16.5 |
| 118 | 🇿🇲 Zambia | 16.4 |
| 119 | 🇩🇿 Algeria | 16.1 |
| 120 | 🇧🇯 Benin | 16.0 |
| 121 | 🇺🇬 Uganda | 16.0 |
| 122 | 🇬🇹 Guatemala | 15.8 |
| 123 | 🇨🇲 Cameroon | 15.3 |
| 124 | 🇧🇫 Burkina Faso | 14.5 |
| 125 | 🇪🇹 Ethiopia | 14.3 |
| 126 | 🇲🇿 Mozambique | 13.6 |
| 127 | 🇲🇷 Mauritania | 13.5 |
| 128 | 🇬🇳 Guinea | 13.3 |
| 129 | 🇲🇱 Mali | 12.9 |
| 130 | 🇧🇮 Burundi | 12.5 |
| 131 | 🇳🇪 Niger | 12.4 |
| 132 | 🇦🇴 Angola | 10.3 |
For full methodology notes on which economies are included in the report, see the bottom of the article.
Sweden ranked second, rising above the U.S. this year. The country excelled in business sophistication, knowledge-intensive employment, and researchers per capita.
While the U.S. ranked third overall, it saw the highest scores in venture capital received, global corporate research and development (R&D) investors, and total unicorn value. Of the 1,206 global unicorns as of April 2023, the U.S. was home to 54% of the total.
At fifth overall, Singapore ranked the highest in Asia. As both a financial hub and global innovator, Singapore ranked strongly on government effectiveness, venture capital received, and stability for business. It has the highest venture funding per capita in the world.
Brazil (49th) ranked highest in Latin America, while Mauritius (57th) was the top-ranking country in Sub-Saharan Africa.
Top 25 Science & Technology Clusters
Here are the top science and technology (S&T) clusters per capita, based on the density of scientific authors and inventors in a geographic location:
| 2023 Ranking | Cluster | Economy | Top Applicant | Top Scientific Organization |
|---|---|---|---|---|
| 1 | Cambridge | 🇬🇧 UK | ARM | Cambridge University |
| 2 | San Jose– San Francisco | 🇺🇸 U.S. | Stanford University | |
| 3 | Oxford | 🇬🇧 UK | Oxford University | Oxford University |
| 4 | Eindhoven | 🇳🇱 Netherlands | Philips Electronics | Eindhoven University of Technology |
| 5 | Boston– Cambridge | 🇺🇸 U.S. | MIT | MIT |
| 6 | Daejeon | 🇰🇷 South Korea | LG Chem | KAIST |
| 7 | Ann Arbor | 🇺🇸 U.S. | University of Michigan | University of Michigan |
| 8 | San Diego | 🇺🇸 U.S. | Qualcomm | University of California San Diego |
| 9 | Seattle | 🇺🇸 U.S. | Microsoft | University of Washington Seattle |
| 10 | Munich | 🇩🇪 Germany | BMW | Technical University of Munich |
| 11 | Kanazawa | 🇯🇵 Japan | Fujitsu | Kanazawa University |
| 12 | Raleigh | 🇺🇸 U.S. | Duke University | Duke University |
| 13 | Göteborg | 🇸🇪 Sweden | LM Ericsson | University of Gothenburg |
| 14 | Beijing | 🇨🇳 China | BOE Technology | Tsinghua University |
| 15 | Stockholm | 🇸🇪 Sweden | LM Ericsson | Karolinska Institutet |
| 16 | Helsinki | 🇫🇮 Finland | Nokia | University of Helsinki |
| 17 | Zürich | 🇨🇭 Switzerland | ETH Zürich | ETH Zürich |
| 18 | Tokyo–Yokohama | 🇯🇵 Japan | Mitsubishi Electric | University of Tokyo |
| 19 | Basel | 🇨🇭 Switzerland, Denmark, France | DSM IP Assets | University of Basel |
| 20 | Copenhagen | 🇩🇰 Denmark | Novo Nordisk | University of Copenhagen |
| 21 | Nuremberg–Erlangen | 🇩🇪 Germany | Siemens | University of Erlangen Nuremberg |
| 22 | Stuttgart | 🇩🇪 Germany | Robert Bosch | Eberhard Karls University of Tübingen |
| 23 | Minneapolis | 🇺🇸 U.S. | 3M Innovative Properties | University of Minnesota Twin Cities |
| 24 | Pittsburgh | 🇺🇸 U.S. | University of Pittsburgh | University of Pittsburgh |
| 25 | Seoul | 🇰🇷 South Korea | Samsung Electronics | Seoul National University |
As the top S&T cluster by intensity, Cambridge produced 37,000 articles per million people. Its top applicant, ARM, is a semiconductor company working closely with Cambridge University. Over 130 billion devices globally have used chips based on ARM’s designs.
The San Jose-San Francisco cluster ranked second, with Google as the top applicant. In 2022, the U.S. granted Google’s parent company Alphabet 2,077 patents.
South Korea’s Daejeon cluster is the top in Asia, led by battery maker LG Chem. In 2022, over 49,000 domestic and overseas patents were registered. In fact, both Honda and GM are partnering with LG Chem to build multi-billion dollar battery factories in Ohio over the next few years.
As we can see, many of the world’s most innovative countries have strong clusters that attract tech firms, researchers, and knowledge-intensive workers due to a host of factors that support disruption and tech advancement.
These tech clusters have a powerful effect on creating innovations that extend across multiple sectors of the economy, and the wider global landscape.
Where Does This Data Come From?
Source: World Intellectual Property Organization Global Innovation Index (2023).
Note: The World Intellectual Property Organization (WIPO) is an agency of the United Nations. It includes 190 UN member states, as well as three non-members: the Cook Islands, Holy See, and Niue.
Countries that are not a part of the WIPO include three UN-recognized countries—the Federated States of Micronesia, Palau and South Sudan—as well as other non-members including Taiwan.


Technology
Countries With the Highest Rates of Crypto Ownership
While the U.S. is a major market for cryptocurrencies, two countries surpass it in terms of their rates of crypto ownership.


Countries With the Highest Rates of Crypto Ownership
This was originally posted on our Voronoi app. Download the app for free on iOS or Android and discover incredible data-driven charts from a variety of trusted sources.
This graphic ranks the top 10 countries by their rate of cryptocurrency ownership, which is the percentage of the population that owns crypto. These figures come from crypto payment gateway, Triple-A, and are as of 2023.
Data and Highlights
The table below lists the rates of crypto ownership in the top 10 countries, as well as the number of people this amounts to.
| Country | % of Population Who Own Crypto | # of Crypto Owners |
|---|---|---|
| 🇦🇪 United Arab Emirates | 30.4 | 3M |
| 🇻🇳 Vietnam | 21.2 | 21M |
| 🇺🇸 U.S. | 15.6 | 53M |
| 🇮🇷 Iran | 13.5 | 12M |
| 🇵🇭 Philippines | 13.4 | 16M |
| 🇧🇷 Brazil | 12 | 26M |
| 🇸🇦 Saudi Arabia | 11.4 | 4M |
| 🇸🇬 Singapore | 11.1 | 665K |
| 🇺🇦 Ukraine | 10.6 | 4M |
| 🇻🇪 Venezuela | 10.3 | 3M |
Note that if we were to rank countries based on their actual number of crypto owners, India would rank first at 93 million people, China would rank second at 59 million people, and the U.S. would rank third at 52 million people.
The UAE Takes the Top Spot
The United Arab Emirates (UAE) boasts the highest rates of crypto ownership globally. The country’s government is considered to be very crypto friendly, as described in Henley & Partners’ Crypto Wealth Report 2023:
In the UAE, the Financial Services Regulatory Authority (FSRA-ADGM) was the first to provide rules and regulations regarding cryptocurrency purchasing and selling. The Emirates are generally very open to new technologies and have proposed zero taxes for crypto owners and businesses.
Vietnam leads Southeast Asia
According to the Crypto Council for Innovation, cryptocurrency holdings in Vietnam are also untaxed, making them an attractive asset.
Another reason for Vietnam’s high rates of ownership could be its large unbanked population (people without access to financial services). Cryptocurrencies may provide an alternative means of accessing these services without relying on traditional banks.
Learn More About Crypto From Visual Capitalist
If you enjoyed this post, be sure to check out The World’s Largest Corporate Holders of Bitcoin, which ranks the top 12 publicly traded companies by their Bitcoin holdings.

-

 Markets6 days ago
Visualized: Interest Rate Forecasts for Advanced Economies
-

 Markets2 weeks ago
Economic Growth Forecasts for G7 and BRICS Countries in 2024
-

 Wealth2 weeks ago
Charted: Which City Has the Most Billionaires in 2024?
-

 Technology2 weeks ago
All of the Grants Given by the U.S. CHIPS Act
-

 Green2 weeks ago
The Carbon Footprint of Major Travel Methods
-

 United States1 week ago
Visualizing the Most Common Pets in the U.S.
-

 Culture1 week ago
The World’s Top Media Franchises by All-Time Revenue
-

 voronoi1 week ago
Best Visualizations of April on the Voronoi App