Technology
Mapped: The Most Popular Video Streaming Service by Country
Mapped: The Most Popular Video Streaming Service by Country
In recent years, video streaming has become an integral part of global entertainment. From Netflix and Amazon Prime to HBO Max and Apple TV, consumers today have many choices when it comes to streaming services.
While some prefer services with their favorite shows and movies, others opt for the most affordable or content-packed options. Often, users band together friends and family and subscribe to multiple streaming services, though some services like Netflix have started to clamp down on the practice.
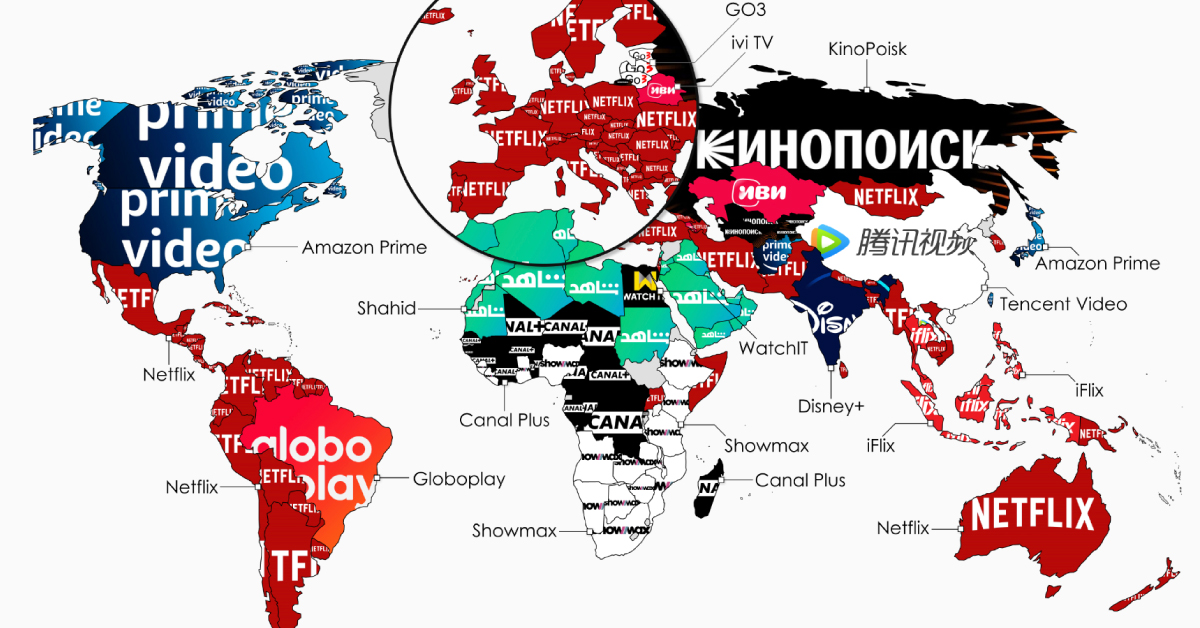
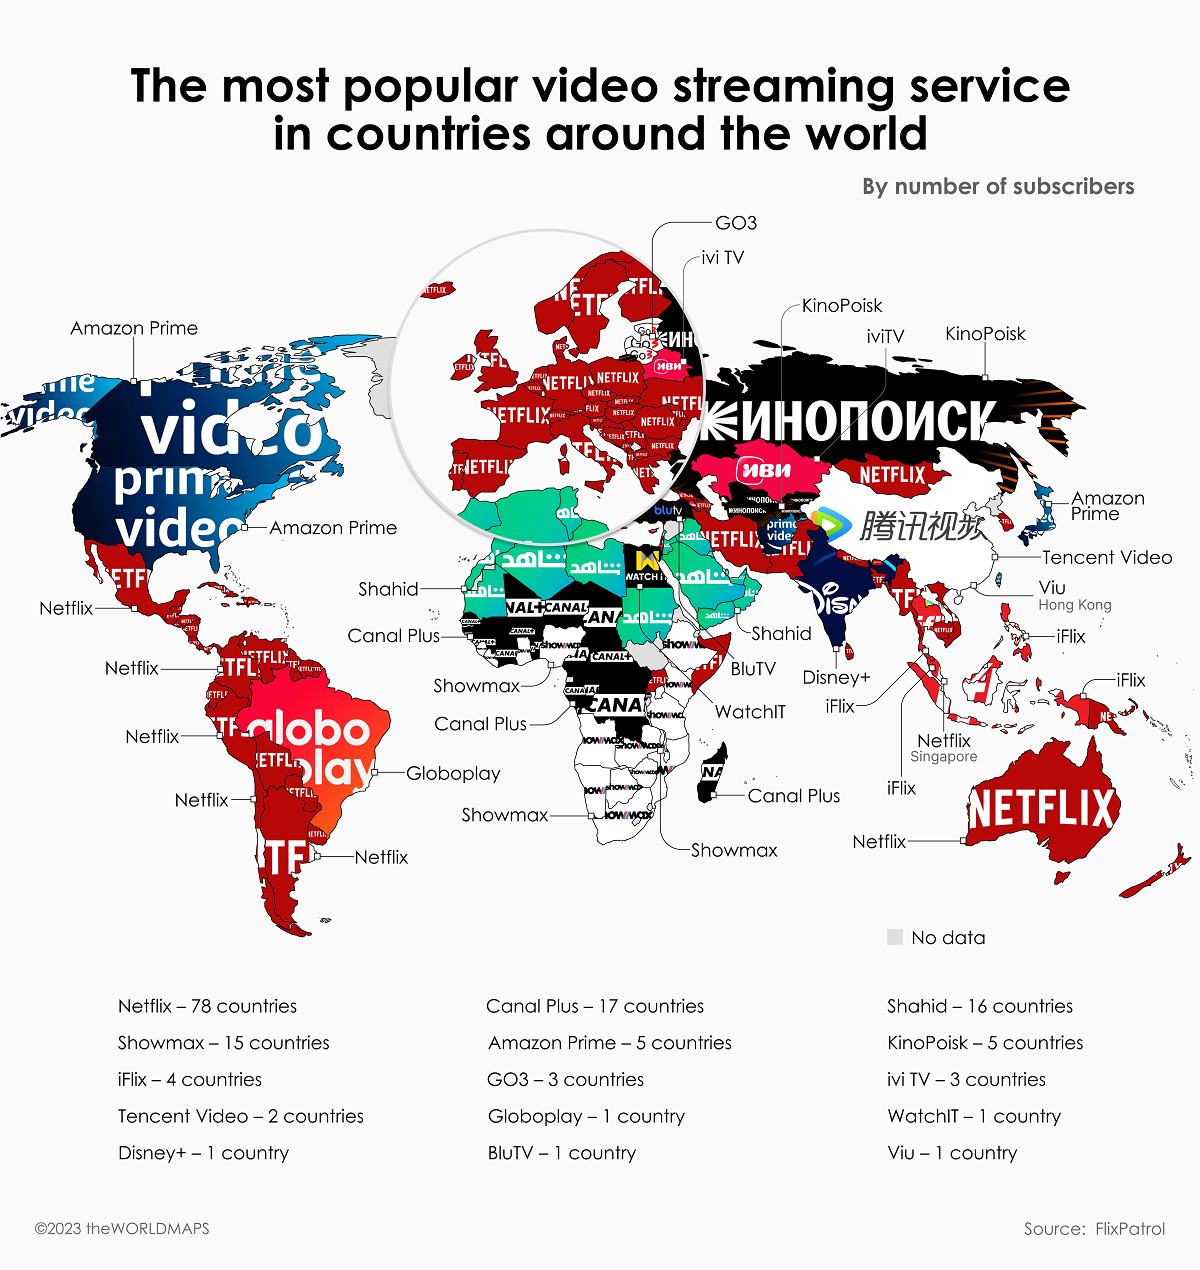
This graphic by theWORLDMAPS uses data from FlixPatrol to highlight the streaming services with the most subscriptions by country in February 2023.
Most Subscribed Streaming Services in 2023
With the highest number of subscribers in 78 countries and over 220 million customers globally, Netflix was the most popular video streaming service in the most countries.
| Streaming Service | Top in Number of Countries |
|---|---|
| Netflix | 78 |
| Canal Plus | 17 |
| Shahid | 16 |
| Showmax | 15 |
| Amazon Prime | 5 |
| KinoPoisk | 5 |
| iFlix | 4 |
| GO3 | 3 |
| ivi TV | 3 |
| Tencent Video | 2 |
| Globoplay | 1 |
| BluTV | 1 |
| Disney+ | 1 |
| Viu | 1 |
| WatchIT | 1 |
In many countries including the UK, Brazil, Germany, France, and Mexico, Netflix had the most subscribers of any service. That’s more than delivery subscription and streaming service Amazon Prime and its 200 million global subscribers.
Because of its large userbase, however, Prime can claim more subscribers than Netflix in five countries: Afghanistan, Canada, Japan, Taiwan, and the U.S..
Other streaming services found success catering to specific regions. The French premium television channel Canal Plus had the highest subscriber count in 17 francophone countries across Central and West Africa. Likewise, the Arabic free video streaming service Shahid topped the list of 16 countries including Egypt, Saudi Arabia, UAE, and Yemen.
And despite having over 160 million global subscribers, Disney+ only made it to the top of India‘s subscriber base. Likewise, Tencent Video was the most-subscribed platform in China with 124 million customers.
Honorable Mentions and Turning Tides
Only 11 video streaming channels made it to the top of the 134 countries tracked by this data.
And while many others did not make the cut, they continue to attract millions of subscribers worldwide.
They include the Chinese platform iQIYI with 106 million subscribers, as well as four American streaming services: HBO Max (79.9M), Hulu (48M), Paramount+ (46M), and Apple TV (40M).
But with both Netflix and Disney+ wrestling with slowing (and declining) subscriber growth, how will the map evolve over the next few years?

This article was published as a part of Visual Capitalist's Creator Program, which features data-driven visuals from some of our favorite Creators around the world.
Technology
Countries With the Highest Rates of Crypto Ownership
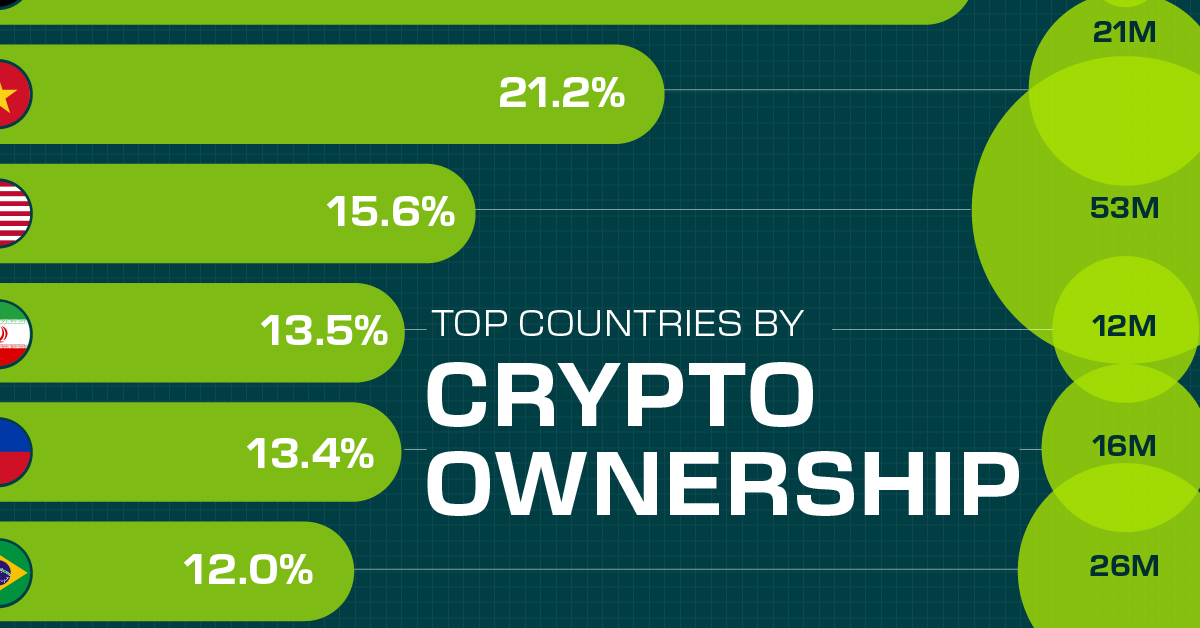
While the U.S. is a major market for cryptocurrencies, two countries surpass it in terms of their rates of crypto ownership.
Countries With the Highest Rates of Crypto Ownership
This was originally posted on our Voronoi app. Download the app for free on iOS or Android and discover incredible data-driven charts from a variety of trusted sources.
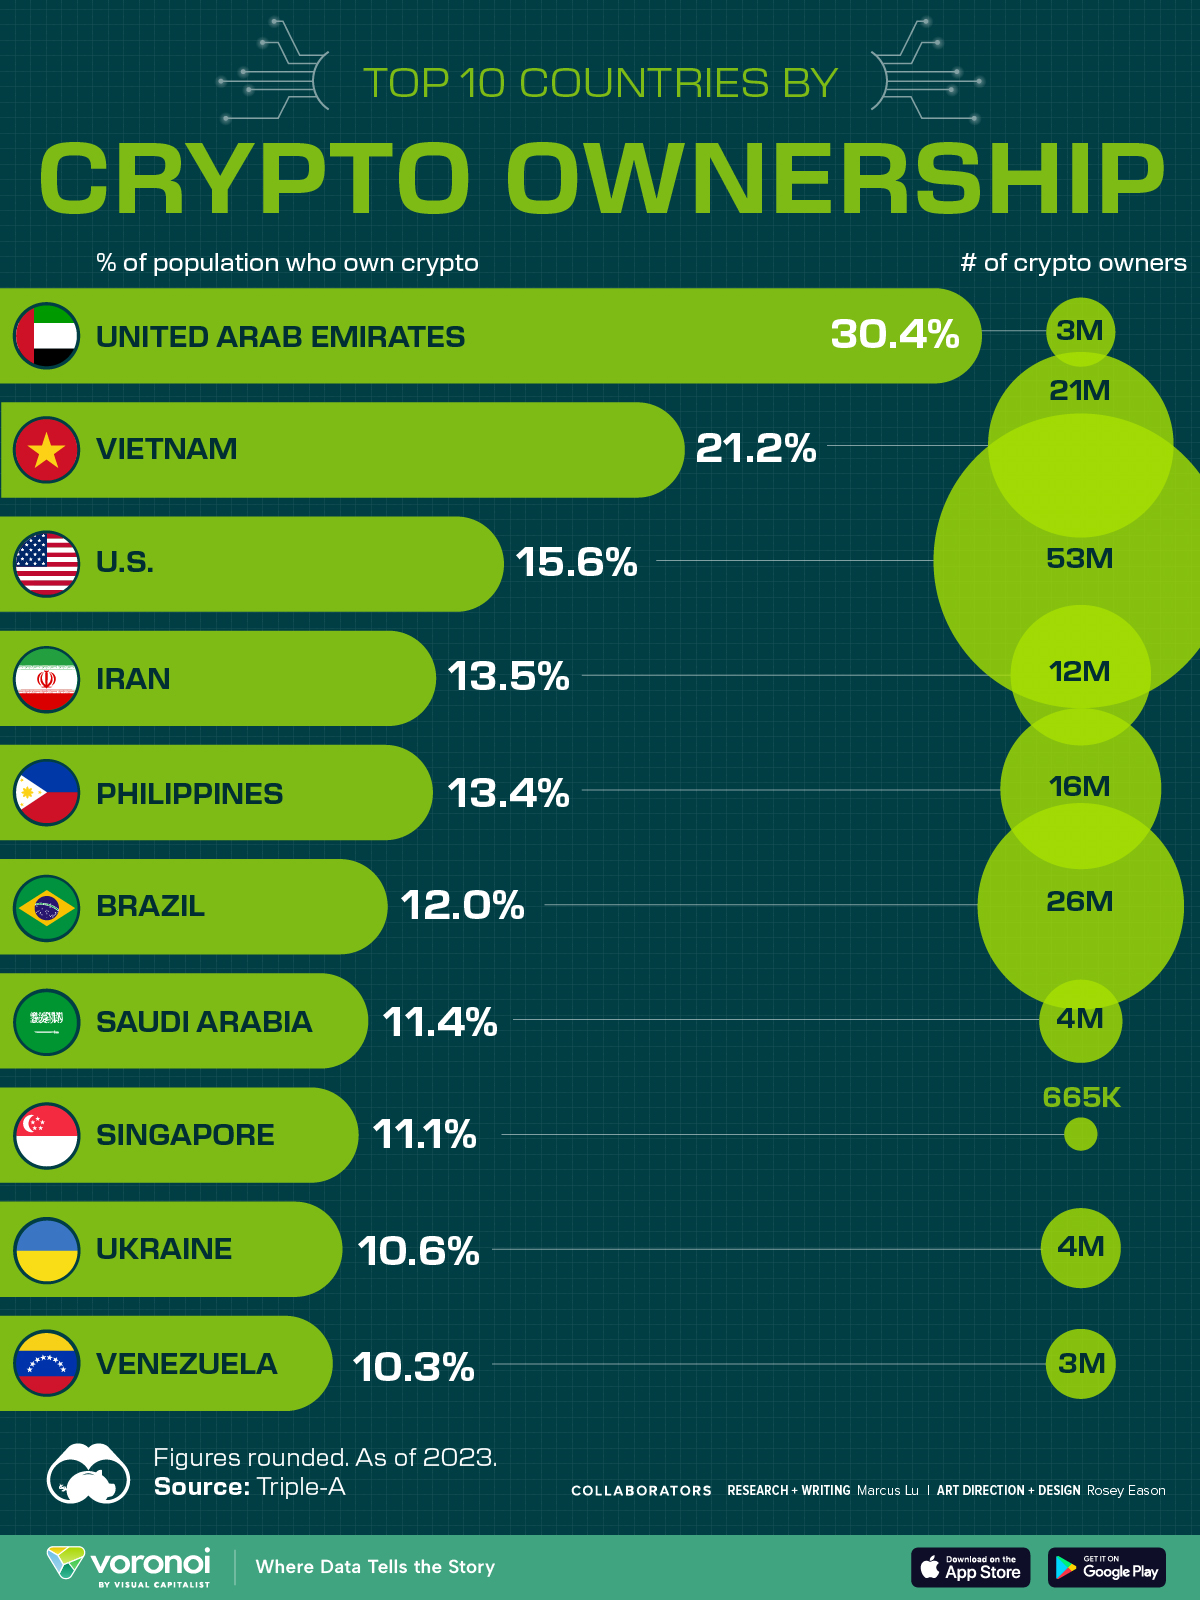
This graphic ranks the top 10 countries by their rate of cryptocurrency ownership, which is the percentage of the population that owns crypto. These figures come from crypto payment gateway, Triple-A, and are as of 2023.
Data and Highlights
The table below lists the rates of crypto ownership in the top 10 countries, as well as the number of people this amounts to.
| Country | % of Population Who Own Crypto | # of Crypto Owners |
|---|---|---|
| 🇦🇪 United Arab Emirates | 30.4 | 3M |
| 🇻🇳 Vietnam | 21.2 | 21M |
| 🇺🇸 U.S. | 15.6 | 53M |
| 🇮🇷 Iran | 13.5 | 12M |
| 🇵🇭 Philippines | 13.4 | 16M |
| 🇧🇷 Brazil | 12 | 26M |
| 🇸🇦 Saudi Arabia | 11.4 | 4M |
| 🇸🇬 Singapore | 11.1 | 665K |
| 🇺🇦 Ukraine | 10.6 | 4M |
| 🇻🇪 Venezuela | 10.3 | 3M |
Note that if we were to rank countries based on their actual number of crypto owners, India would rank first at 93 million people, China would rank second at 59 million people, and the U.S. would rank third at 52 million people.
The UAE Takes the Top Spot
The United Arab Emirates (UAE) boasts the highest rates of crypto ownership globally. The country’s government is considered to be very crypto friendly, as described in Henley & Partners’ Crypto Wealth Report 2023:
In the UAE, the Financial Services Regulatory Authority (FSRA-ADGM) was the first to provide rules and regulations regarding cryptocurrency purchasing and selling. The Emirates are generally very open to new technologies and have proposed zero taxes for crypto owners and businesses.
Vietnam leads Southeast Asia
According to the Crypto Council for Innovation, cryptocurrency holdings in Vietnam are also untaxed, making them an attractive asset.
Another reason for Vietnam’s high rates of ownership could be its large unbanked population (people without access to financial services). Cryptocurrencies may provide an alternative means of accessing these services without relying on traditional banks.
Learn More About Crypto From Visual Capitalist
If you enjoyed this post, be sure to check out The World’s Largest Corporate Holders of Bitcoin, which ranks the top 12 publicly traded companies by their Bitcoin holdings.
-

 Energy5 days ago
Who’s Building the Most Solar Energy?
-

 Wealth2 weeks ago
Charted: Which Country Has the Most Billionaires in 2024?
-

 Business2 weeks ago
The Top Private Equity Firms by Country
-

 Markets2 weeks ago
The Best U.S. Companies to Work for According to LinkedIn
-

 Economy1 week ago
Ranked: The Top 20 Countries in Debt to China
-

 Politics1 week ago
Charted: Trust in Government Institutions by G7 Countries
-

 Energy1 week ago
Mapped: The Age of Energy Projects in Interconnection Queues, by State
-

 Mining1 week ago
Visualizing Global Gold Production in 2023

