Markets
Animation: The Largest Public Companies by Market Cap (2000–2022)
Article/Editing:
The Largest Public Companies by Market Cap (2000–2022)
The 10 largest public companies in the world had a combined market capitalization of nearly $12 trillion as of July 2022.
But two decades ago, the players that made up the list of the largest companies by market capitalization were radically different—and as the years ticked by, emerging megatrends and market sentiment have worked to shuffle the deck multiple times.
This racing bar chart by Truman Du shows how the ranking of the top 10 largest public companies has changed from 2000 to 2022.
Market Cap vs. Market Value
Before diving in, it’s worth noting that market capitalization is just one of many metrics that can be used to help value a company.
Simply put, a company’s market cap measures the combined price of a company’s outstanding shares—in other words, it’s the price someone would pay if they wanted to purchase the company outright at current stock prices (theoretically speaking).
But while a market cap provides insight into what equity is worth at a given time, calculating the market value is far more complicated and nuanced. After all, a price paid might not reflect the actual value of a business. To get a measure of value, other metrics like a company’s price-to-sales (P/S) ratio, price-to-earnings (P/E) ratio, or return-on-equity (ROE) may be considered.
The Largest Public Companies by Market Cap (2000–2022)
Over the last two decades, investor sentiment has shifted as different trends have played out, and the types of companies buoyed up by the market have changed as well.
For instance, tech and telecom companies were big in the very early 2000s, as investors got excited about the seemingly endless potential of the newly-introduced World Wide Web.
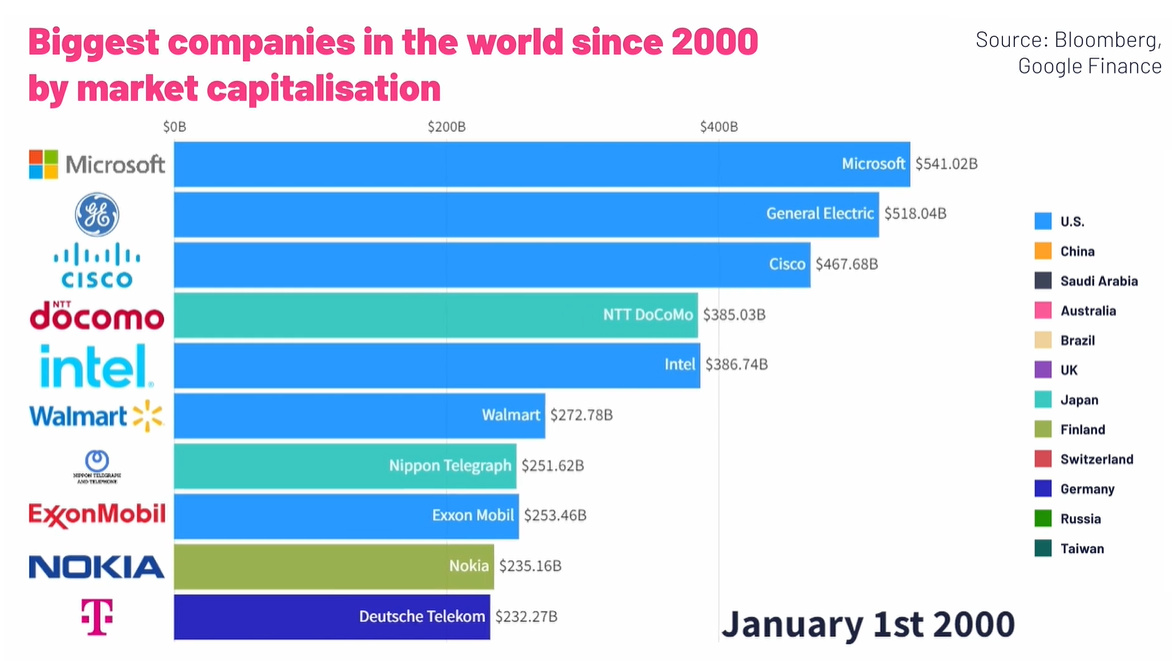
Largest Companies by Market Cap (January 1, 2000)
| Rank | Company | Market Cap (Jan 1, 2000) |
|---|---|---|
| #1 | 🇺🇸 Microsoft | $606 billion |
| #2 | 🇺🇸 General Electric | $508 billion |
| #3 | 🇯🇵 NTT Docomo | $367 billion |
| #4 | 🇺🇸 Cisco | $352 billion |
| #5 | 🇺🇸 Walmart | $302 billion |
| #6 | 🇺🇸 Intel | $280 billion |
| #7 | 🇯🇵 Nippon Telegraph | $271 billion |
| #8 | 🇫🇮 Nokia | $219 billion |
| #9 | 🇺🇸 Pfizer | $206 billion |
| #10 | 🇩🇪 Deutsche Telekom | $197 billion |
In the middle of the Dotcom bubble, investors were pouring money into internet-related tech startups. As PC and internet adoption picked up, investors hoped to “get in early” before these companies started to really turn a profit. This overzealous sentiment is reflected in the market capitalizations of public companies at the time, especially in the tech or telecom companies that were seen as benefitting from the internet boom.
Of course, the Dotcom bubble was not meant to last, and by January 2004 the top 10 list was looking much more diverse. At this time, Microsoft had lost the top spot to General Electric, which had a market cap of $309 billion. Then in the late 2000s, energy companies such as ExxonMobil, PetroChina, Gazprom, and BP took over the list as oil prices spiked well over $100 per barrel.
But fast forward to 2022, and we’ve come full circle, with Big Tech back in the limelight again.
Largest Companies by Market Cap (July 1, 2022)
| Rank | Company | Market Cap (Jul 1, 2022) |
|---|---|---|
| #1 | 🇸🇦 Saudi Aramco | $2.27 trillion |
| #2 | 🇺🇸 Apple | $2.25 trillion |
| #3 | 🇺🇸 Microsoft | $1.94 trillion |
| #4 | 🇺🇸 Alphabet | $1.43 trillion |
| #5 | 🇺🇸 Amazon | $1.11 trillion |
| #6 | 🇺🇸 Tesla | $707 billion |
| #7 | 🇺🇸 Berkshire Hathaway | $612 billion |
| #8 | 🇺🇸 United Health Group | $485 billion |
| #9 | 🇺🇸 Johnson & Johnson | $472 billion |
| #10 | 🇨🇳 Tencent | $435 billion |
Four of the five largest companies are in tech, and Tencent also cracks the list. Meanwhile, Tesla is classified as an automotive company, but it is thought of as an “internet of cars” company by many investors.
Big Picture Trends in the Top 10 by Market Cap List
| Year | Description | Top Company (Market Cap USD) | Top 10 Description |
|---|---|---|---|
| 2000 | Dotcom Bubble | Microsoft ($606B) | Multiple tech/telecom companies in the mix |
| 2004 | Post-Bubble | GE ($309B) | Diverse mix of companies by industry |
| 2009 | Financial Crisis | PetroChina ($367B) | Six non-U.S. companies make the list |
| 2014 | $100 Oil | Apple ($560B) | Last year of oil-dominated list; tech starts ascending |
| 2022 | Big Tech Era | Aramco ($2,270B)* | Tech accounts for 80% of Top 5 companies |
*As of July 1, 2022. Since then, Saudi Aramco has been re-surpassed by Apple due to a reversal in oil prices.
Trending Downwards?
Amidst rising interest rates, crippling inflation, and political issues like the ongoing conflict in Ukraine, signs point towards a potential global recession. Tech companies fared well during the COVID-19 pandemic, but will likely not be immune to the impacts of a generalized economic slowdown.
It’ll be interesting to see how things pan out in 2023, and which companies (if any) will manage to stay on top throughout the turmoil.

This article was published as a part of Visual Capitalist's Creator Program, which features data-driven visuals from some of our favorite Creators around the world.


Maps
Mapped: The 10 U.S. States With the Lowest Real GDP Growth
In this graphic, we show where real GDP lagged the most across America in 2023 as high interest rates weighed on state economies.


The Top 10 U.S. States, by Lowest Real GDP Growth
This was originally posted on our Voronoi app. Download the app for free on iOS or Android and discover incredible data-driven charts from a variety of trusted sources.
While the U.S. economy defied expectations in 2023, posting 2.5% in real GDP growth, several states lagged behind.
Last year, oil-producing states led the pack in terms of real GDP growth across America, while the lowest growth was seen in states that were more sensitive to the impact of high interest rates, particularly due to slowdowns in the manufacturing and finance sectors.
This graphic shows the 10 states with the least robust real GDP growth in 2023, based on data from the Bureau of Economic Analysis.
Weakest State Economies in 2023
Below, we show the states with the slowest economic activity in inflation-adjusted terms, using chained 2017 dollars:
| Rank | State | Real GDP Growth 2023 YoY | Real GDP 2023 |
|---|---|---|---|
| 1 | Delaware | -1.2% | $74B |
| 2 | Wisconsin | +0.2% | $337B |
| 3 | New York | +0.7% | $1.8T |
| 4 | Missississippi | +0.7% | $115B |
| 5 | Georgia | +0.8% | $661B |
| 6 | Minnesota | +1.2% | $384B |
| 7 | New Hampshire | +1.2% | $91B |
| 8 | Ohio | +1.2% | $698B |
| 9 | Iowa | +1.3% | $200B |
| 10 | Illinois | +1.3% | $876B |
| U.S. | +2.5% | $22.4T |
Delaware witnessed the slowest growth in the country, with real GDP growth of -1.2% over the year as a sluggish finance and insurance sector dampened the state’s economy.
Like Delaware, the Midwestern state of Wisconsin also experienced declines across the finance and insurance sector, in addition to steep drops in the agriculture and manufacturing industries.
America’s third-biggest economy, New York, grew just 0.7% in 2023, falling far below the U.S. average. High interest rates took a toll on key sectors, with notable slowdowns in the construction and manufacturing sectors. In addition, falling home prices and a weaker job market contributed to slower economic growth.
Meanwhile, Georgia experienced the fifth-lowest real GDP growth rate. In March 2024, Rivian paused plans to build a $5 billion EV factory in Georgia, which was set to be one of the biggest economic development initiatives in the state in history.
These delays are likely to exacerbate setbacks for the state, however, both Kia and Hyundai have made significant investments in the EV industry, which could help boost Georgia’s manufacturing sector looking ahead.

-

 Personal Finance1 week ago
Visualizing the Tax Burden of Every U.S. State
-

 Misc6 days ago
Visualized: Aircraft Carriers by Country
-

 Culture7 days ago
How Popular Snack Brand Logos Have Changed
-

 Mining1 week ago
Visualizing Copper Production by Country in 2023
-

 Misc1 week ago
Charted: How Americans Feel About Federal Government Agencies
-

 Healthcare1 week ago
Which Countries Have the Highest Infant Mortality Rates?
-

 Demographics1 week ago
Mapped: U.S. Immigrants by Region
-

 Maps1 week ago
Mapped: Southeast Asia’s GDP Per Capita, by Country