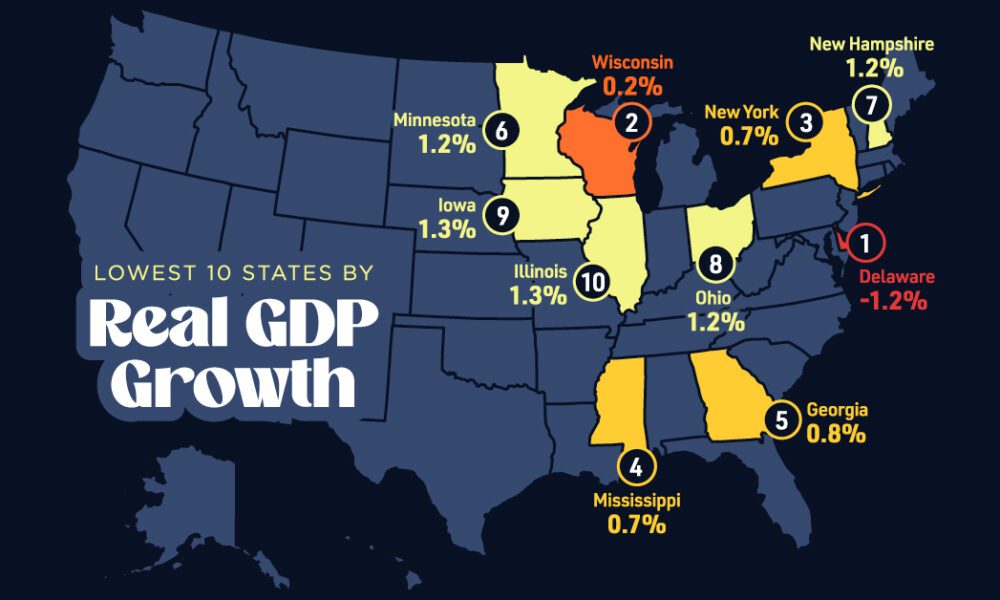

In this graphic, we show where real GDP lagged the most across America in 2023 as high interest rates weighed...

Everything you ever wanted to know about consumer debt in one infographic. We show the historical context, as well as the latest numbers for each category.
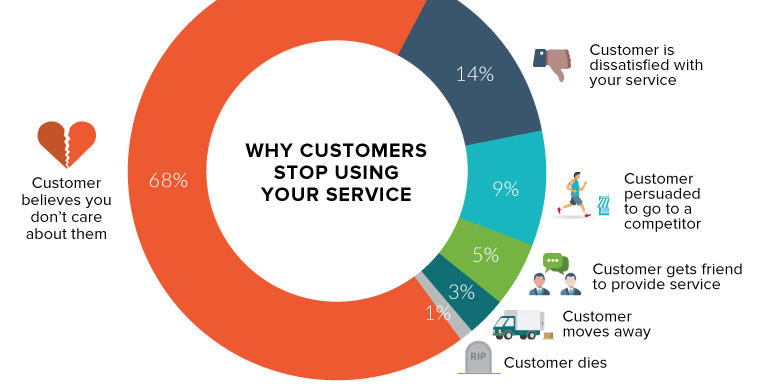
An astonishing two-thirds of your customers leave because they think you don't care about them. Here's how to change that.
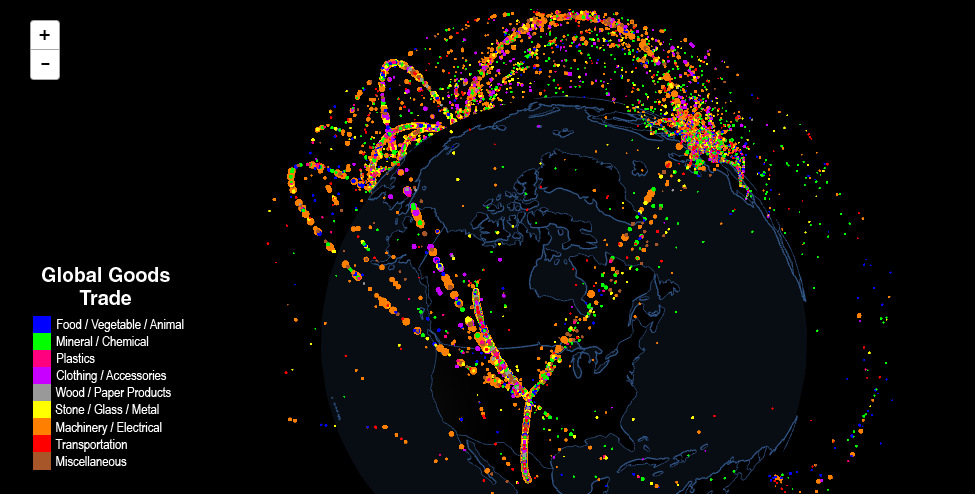
Use this interactive map to explore fascinating data on international trade. Which countries trade with each other, and which are stuck as hermits?

The market for commercial drones is soaring at an astonishing 19% annual growth rate - see the history of drones, and how they will impact you.
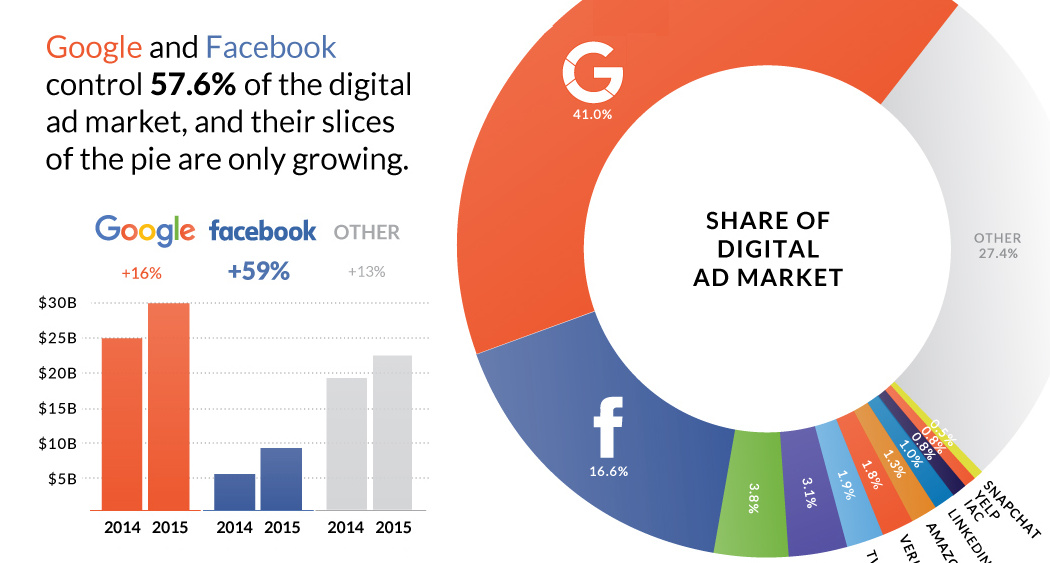
Nearly $0.60 of every $1.00 spent on digital advertising goes to Google and Facebook.
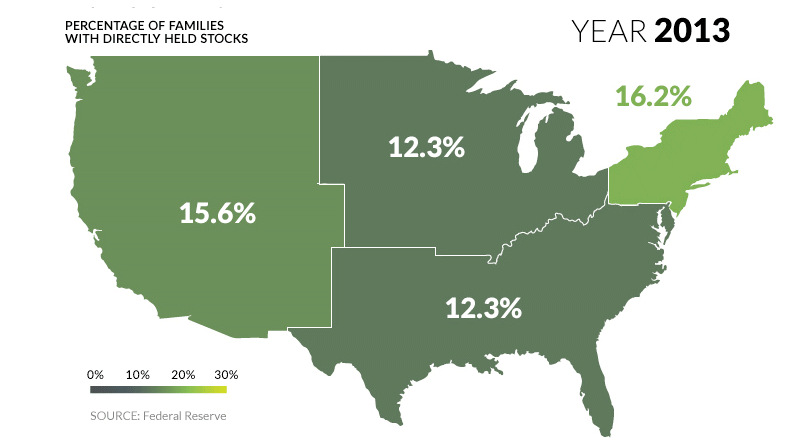
U.S. markets continue to hit all-time highs, but what percentage of population actually benefits? See stock ownership across the U.S. on this animated map.
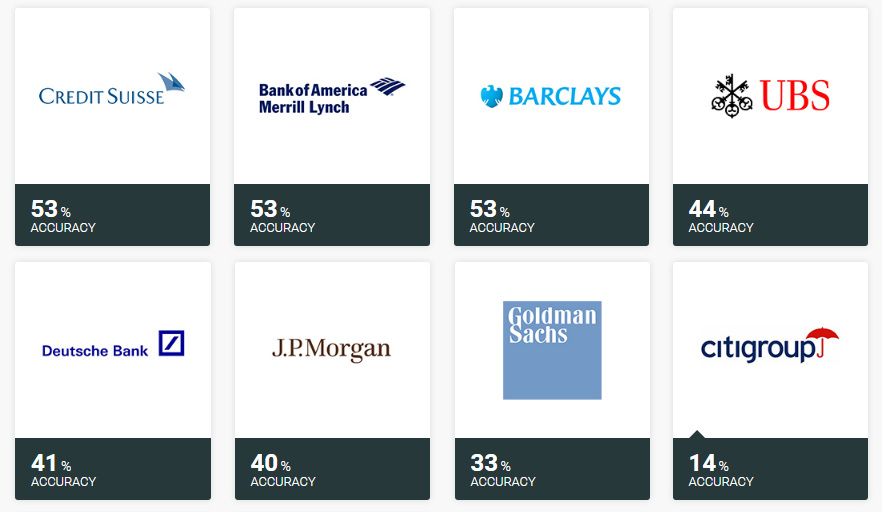
Ever wonder how accurate investment banks are with their stock picks? Here's the answer to that question, and it's not pretty.
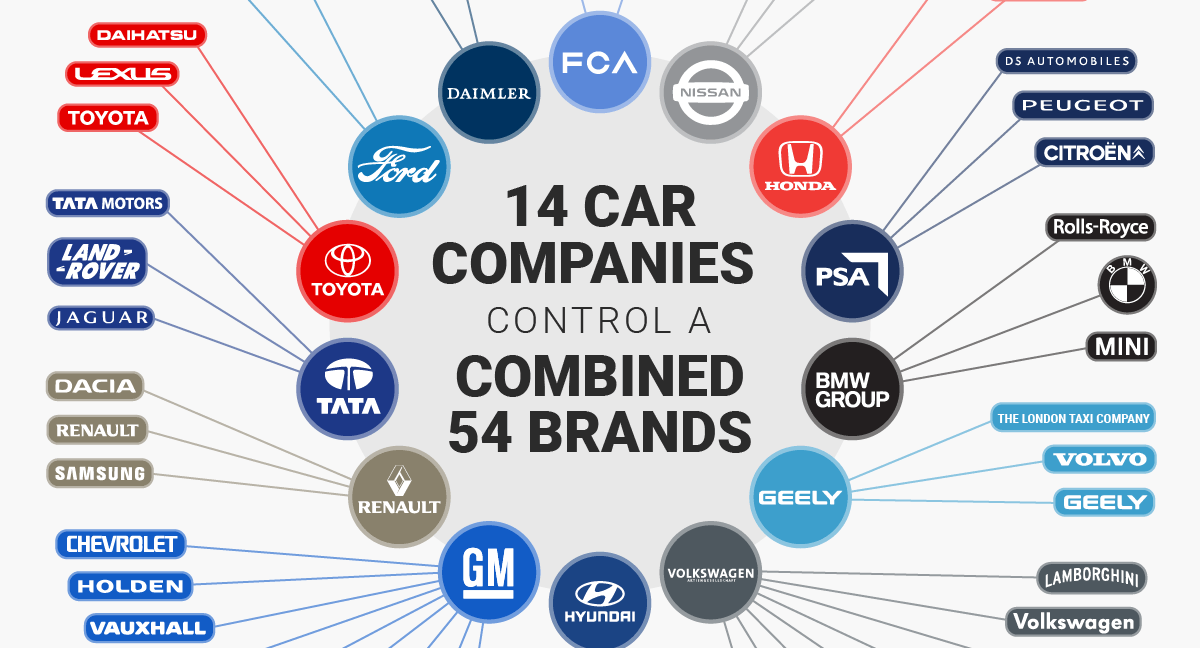
Looking to buy a new vehicle? You may have less choice than you might think - a total of 14 companies actually control 54 brands in...
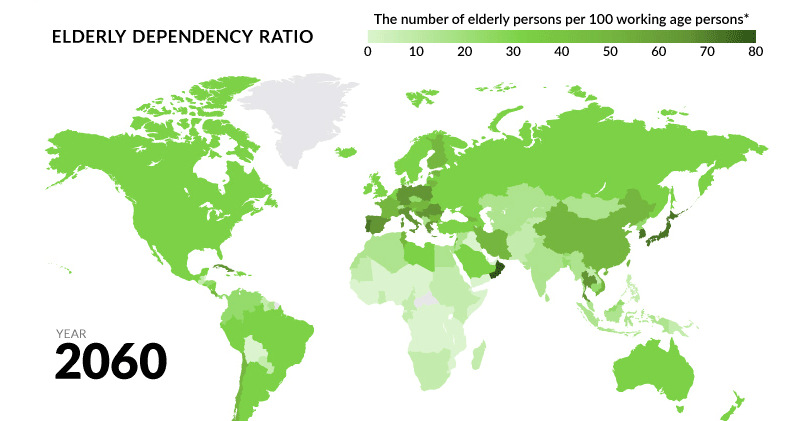
Globally, fertility rates have decreased by about half since 1960. What will happen to the economy when the world's aging population begins to retire?
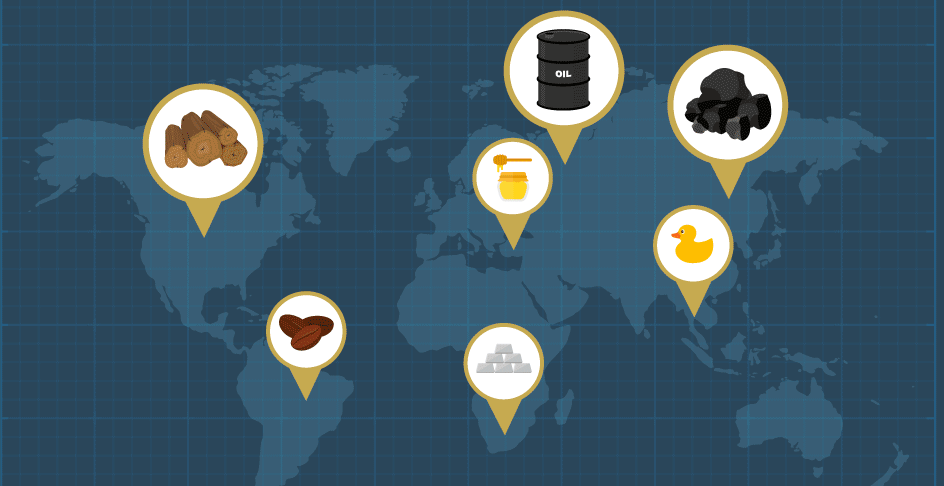
Every “thing” comes from somewhere. Whether we are talking about an iPhone or a battery, even the most complex technological device is made up of the...


