Markets
Most Banks Are Screwing Up On Their Stock Picks
Let’s say that a bank such as Goldman Sachs publishes a recommendation to “Buy Stock X”.
It’s hard to ignore a bet by a powerful investment bank such as Goldman. We are mere mortals in the pecking order, and they are supposed to be the all-knowing smart money from Wall Street.
Do we buy the stock, or is it simply wiser to pass?
Bank Performance Overall
The folks at InterTrader have done considerable legwork to dive deep into the data on investment bank recommendations made in 2015. They looked at every bet made by the 16 top banks throughout the year to assess both potential returns and accuracy.
The results are pretty underwhelming.
If you bought every stock recommended and held until the end of the year, here’s what your performance would look like:
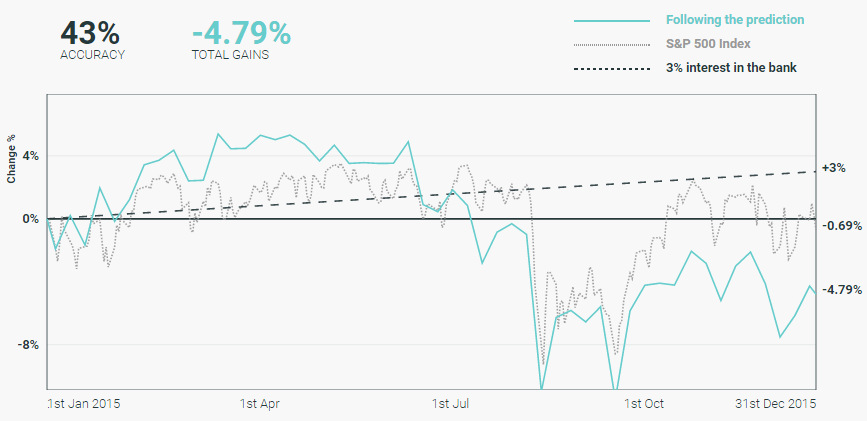
Overall, when holding the stock picks for the year, banks were only 43% accurate with their predictions.
That’s right – flipping a coin would have been potentially more effective than buying bank stock picks, which ended up down -4.79% on the year. The S&P 500 finished down only -0.69%, but simply just making any interest in a savings account would have been more effective as well.
A Closer Look at Individual Banks
While banks as a whole struggled with picks in 2015, it’s also important to look at banks on a more micro level to see how they performed.
Here’s a look at the recommendations by Deutsche Bank, and how they did:
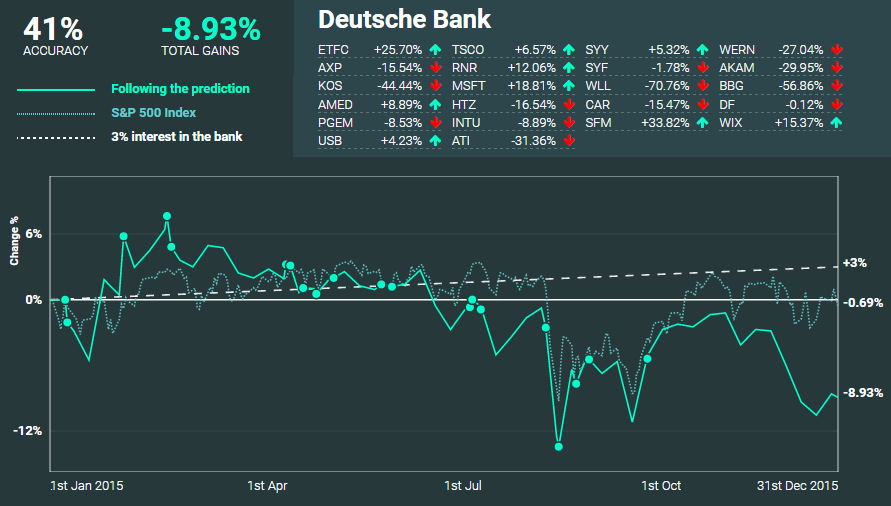
Deutsche Bank nailed 41% of their predictions, and had a -8.93% return if picks were held throughout the year.
As you can see, some of their picks such as Microsoft and Wix.com gained double digits. On the other hand, recommendations such as Whiting Petroleum got absolutely crushed throughout the year, dropping -70.1%.
Overall, Deutsche Bank’s performance here definitely didn’t do much to help the struggling company get out of its rut.
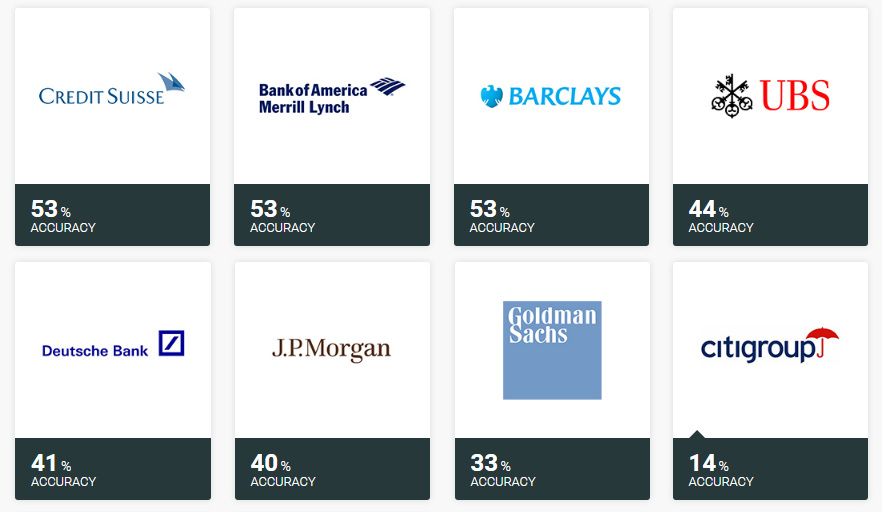
Which Banks Were Most Accurate?
Here are the banks, from best to worst, based on accuracy of their calls:
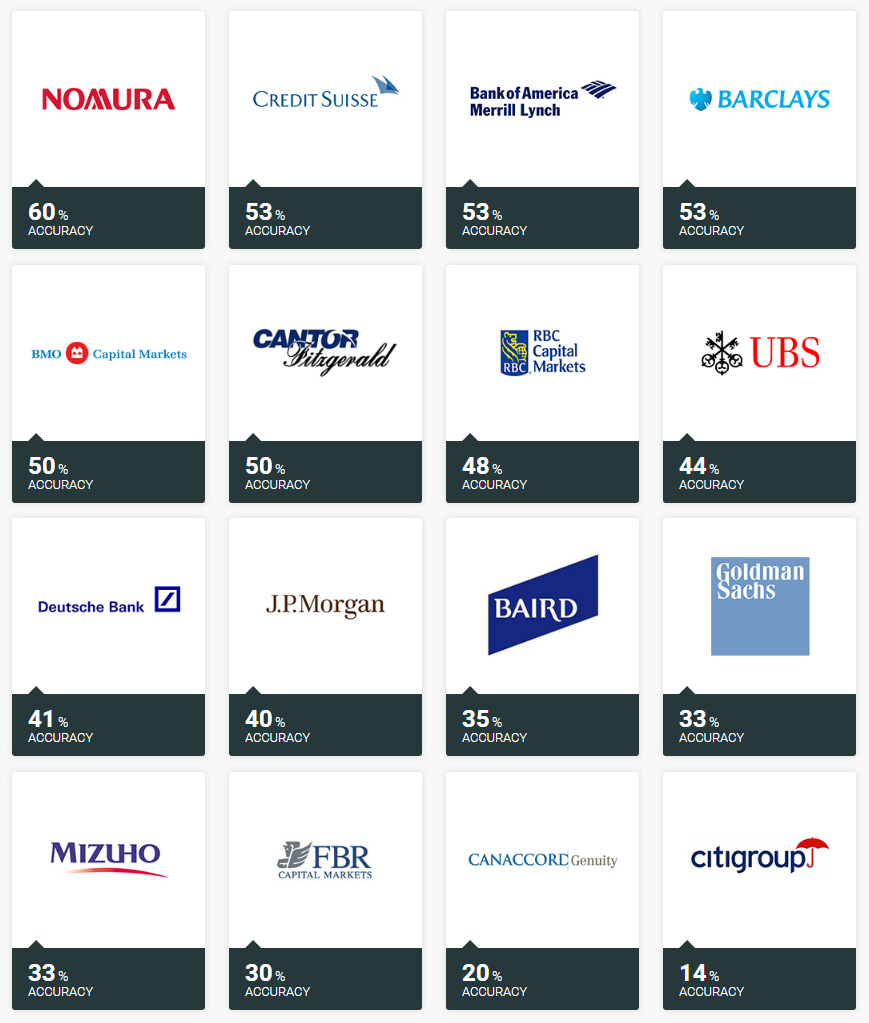
Nomura, Credit Suisse, BAML, and Barclays all batted above .500 if stocks were held throughout the year, while 10 banks all did worse than a coin flip.
Citigroup had an off year, only nailing 14% of its picks.
Which Banks Had the Best Returns?
Here are the banks, from best to worst, based on the performance of these recommendations:
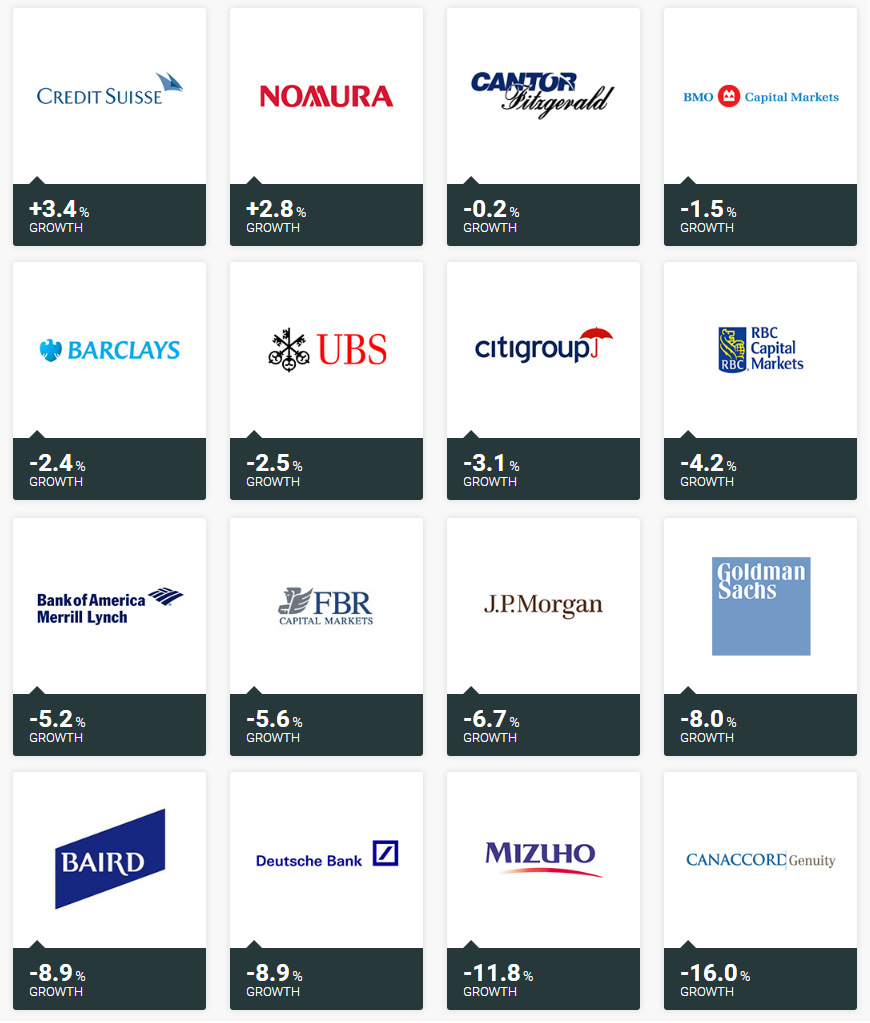
Just two banks, Credit Suisse and Nomura, had positive returns if stocks were held through the year. Meanwhile, Canaccord Genuity’s picks were knocked down -16% over the course of 2015.
An Important Caveat
Throughout the above article, we are showing the results if stock picks were held from when they were made until the end of the year.
However, it is worth noting that the investment banks actually did slightly better if picks were held for shorter durations of time:
| Time | Accuracy | Gains % |
|---|---|---|
| 30 Days | 55% | 0.80% |
| 90 Days | 49% | -1.48% |
| 180 Days | 42% | -3.66% |
| End of Year | 43% | -4.79% |
In other words – if you sold all stock recommendations exactly 30 days after buying, you would have actually made a 0.8% return throughout the year. This is still a lower return than a savings account, but it is an improvement on losing -4.79%!
For a more in-depth dive into the data, we highly recommend checking out InterTrader’s interactive version of the results.


Markets
U.S. Debt Interest Payments Reach $1 Trillion
U.S. debt interest payments have surged past the $1 trillion dollar mark, amid high interest rates and an ever-expanding debt burden.


U.S. Debt Interest Payments Reach $1 Trillion
This was originally posted on our Voronoi app. Download the app for free on iOS or Android and discover incredible data-driven charts from a variety of trusted sources.
The cost of paying for America’s national debt crossed the $1 trillion dollar mark in 2023, driven by high interest rates and a record $34 trillion mountain of debt.
Over the last decade, U.S. debt interest payments have more than doubled amid vast government spending during the pandemic crisis. As debt payments continue to soar, the Congressional Budget Office (CBO) reported that debt servicing costs surpassed defense spending for the first time ever this year.
This graphic shows the sharp rise in U.S. debt payments, based on data from the Federal Reserve.
A $1 Trillion Interest Bill, and Growing
Below, we show how U.S. debt interest payments have risen at a faster pace than at another time in modern history:
| Date | Interest Payments | U.S. National Debt |
|---|---|---|
| 2023 | $1.0T | $34.0T |
| 2022 | $830B | $31.4T |
| 2021 | $612B | $29.6T |
| 2020 | $518B | $27.7T |
| 2019 | $564B | $23.2T |
| 2018 | $571B | $22.0T |
| 2017 | $493B | $20.5T |
| 2016 | $460B | $20.0T |
| 2015 | $435B | $18.9T |
| 2014 | $442B | $18.1T |
| 2013 | $425B | $17.2T |
| 2012 | $417B | $16.4T |
| 2011 | $433B | $15.2T |
| 2010 | $400B | $14.0T |
| 2009 | $354B | $12.3T |
| 2008 | $380B | $10.7T |
| 2007 | $414B | $9.2T |
| 2006 | $387B | $8.7T |
| 2005 | $355B | $8.2T |
| 2004 | $318B | $7.6T |
| 2003 | $294B | $7.0T |
| 2002 | $298B | $6.4T |
| 2001 | $318B | $5.9T |
| 2000 | $353B | $5.7T |
| 1999 | $353B | $5.8T |
| 1998 | $360B | $5.6T |
| 1997 | $368B | $5.5T |
| 1996 | $362B | $5.3T |
| 1995 | $357B | $5.0T |
| 1994 | $334B | $4.8T |
| 1993 | $311B | $4.5T |
| 1992 | $306B | $4.2T |
| 1991 | $308B | $3.8T |
| 1990 | $298B | $3.4T |
| 1989 | $275B | $3.0T |
| 1988 | $254B | $2.7T |
| 1987 | $240B | $2.4T |
| 1986 | $225B | $2.2T |
| 1985 | $219B | $1.9T |
| 1984 | $205B | $1.7T |
| 1983 | $176B | $1.4T |
| 1982 | $157B | $1.2T |
| 1981 | $142B | $1.0T |
| 1980 | $113B | $930.2B |
| 1979 | $96B | $845.1B |
| 1978 | $84B | $789.2B |
| 1977 | $69B | $718.9B |
| 1976 | $61B | $653.5B |
| 1975 | $55B | $576.6B |
| 1974 | $50B | $492.7B |
| 1973 | $45B | $469.1B |
| 1972 | $39B | $448.5B |
| 1971 | $36B | $424.1B |
| 1970 | $35B | $389.2B |
| 1969 | $30B | $368.2B |
| 1968 | $25B | $358.0B |
| 1967 | $23B | $344.7B |
| 1966 | $21B | $329.3B |
Interest payments represent seasonally adjusted annual rate at the end of Q4.
At current rates, the U.S. national debt is growing by a remarkable $1 trillion about every 100 days, equal to roughly $3.6 trillion per year.
As the national debt has ballooned, debt payments even exceeded Medicaid outlays in 2023—one of the government’s largest expenditures. On average, the U.S. spent more than $2 billion per day on interest costs last year. Going further, the U.S. government is projected to spend a historic $12.4 trillion on interest payments over the next decade, averaging about $37,100 per American.
Exacerbating matters is that the U.S. is running a steep deficit, which stood at $1.1 trillion for the first six months of fiscal 2024. This has accelerated due to the 43% increase in debt servicing costs along with a $31 billion dollar increase in defense spending from a year earlier. Additionally, a $30 billion increase in funding for the Federal Deposit Insurance Corporation in light of the regional banking crisis last year was a major contributor to the deficit increase.
Overall, the CBO forecasts that roughly 75% of the federal deficit’s increase will be due to interest costs by 2034.

-

 Green1 week ago
Ranked: The Countries With the Most Air Pollution in 2023
-

 Automotive2 weeks ago
Almost Every EV Stock is Down After Q1 2024
-

 AI2 weeks ago
The Stock Performance of U.S. Chipmakers So Far in 2024
-

 Markets2 weeks ago
Charted: Big Four Market Share by S&P 500 Audits
-

 Real Estate2 weeks ago
Ranked: The Most Valuable Housing Markets in America
-

 Money2 weeks ago
Which States Have the Highest Minimum Wage in America?
-

 AI2 weeks ago
Ranked: Semiconductor Companies by Industry Revenue Share
-

 Travel2 weeks ago
Ranked: The World’s Top Flight Routes, by Revenue