Mapped: Europe’s GDP Per Capita, by Country
The Growth of a $1,000 Equity Investment, by Stock Market
Mapped: The Most Valuable Company in Each Southeast Asian Country
Visualizing Global Inflation Forecasts (2024-2026)
The World’s Fastest Growing Emerging Markets (2024-2029 Forecast)
Countries With the Highest Rates of Crypto Ownership
Mapped: The Number of AI Startups By Country
All of the Grants Given by the U.S. CHIPS Act
Visualizing AI Patents by Country
How Tech Logos Have Evolved Over Time
Visualizing the Tax Burden of Every U.S. State
Charted: What Frustrates Americans About the Tax System
Ranked: The Top 20 Countries in Debt to China
Charted: Which Country Has the Most Billionaires in 2024?
Charted: Which City Has the Most Billionaires in 2024?
Mapped: Countries Where Recreational Cannabis is Legal
Which Countries Have the Highest Infant Mortality Rates?
Life Expectancy by Region (1950-2050F)
What Causes Preventable Child Deaths?
The Cost of an EpiPen in Major Markets
Who’s Building the Most Solar Energy?
Mapped: The Age of Energy Projects in Interconnection Queues, by State
Ranked: The Top 10 EV Battery Manufacturers in 2023
The World’s Biggest Nuclear Energy Producers
The World’s Biggest Oil Producers in 2023
Mapped: U.S. States By Number of Cities Over 250,000 Residents
Mapped: U.S. Immigrants by Region
Mapped: Southeast Asia’s GDP Per Capita, by Country
The Largest Earthquakes in the New York Area (1970-2024)
Visualizing Copper Production by Country in 2023
Where the World’s Aluminum is Smelted, by Country
Visualizing Global Gold Production in 2023
Gold vs. S&P 500: Which Has Grown More Over Five Years?
How People Get Around in America, Europe, and Asia
The Carbon Footprint of Major Travel Methods
Ranking the Top 15 Countries by Carbon Tax Revenue
Ranked: The Countries With the Most Air Pollution in 2023
Top Countries By Forest Growth Since 2001
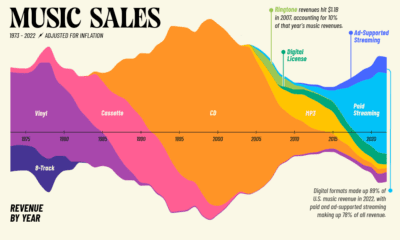
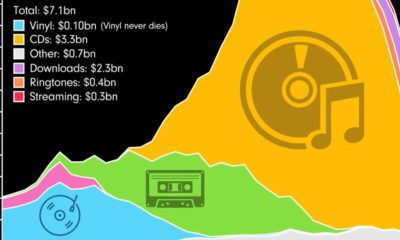
50 years in music has seen consumption change from vinyl and cassettes to CDs and streaming. This video highlights sales of music formats over time.
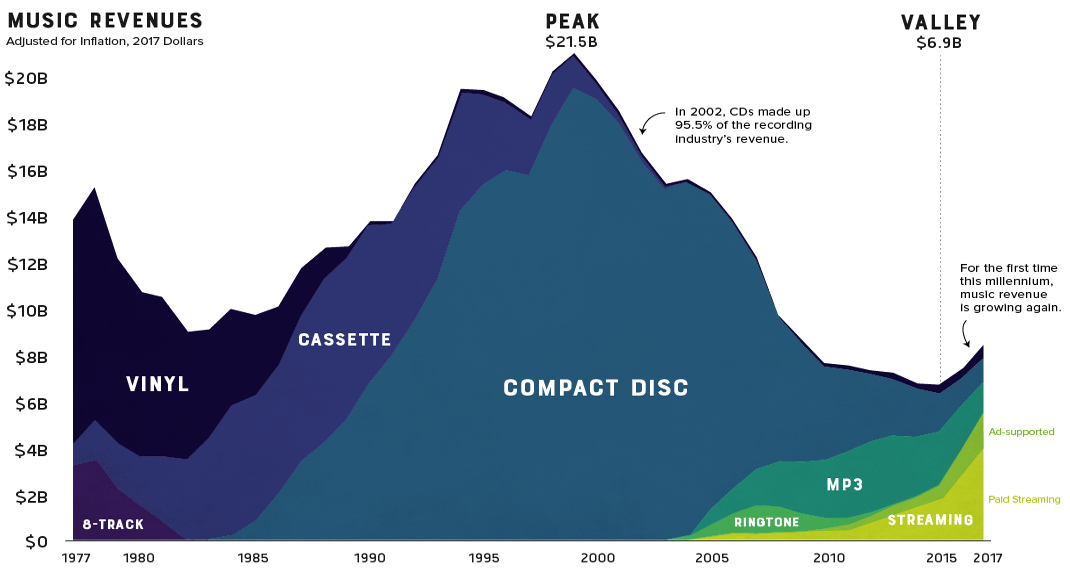
The music industry has undergone a remarkable transformation in formats. See how its revenues have evolved, from vinyl and CDs to streaming.
This graphic shows the percentage of Americans that are monthly music listeners for each service. Which online music service is most popular?
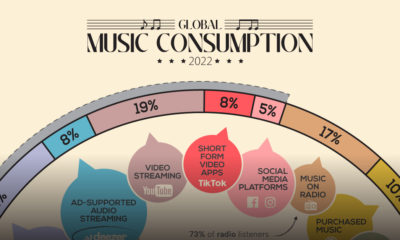
This infographic explores how the music streaming industry generates almost half of the global music market's $19.1 billion in revenue.
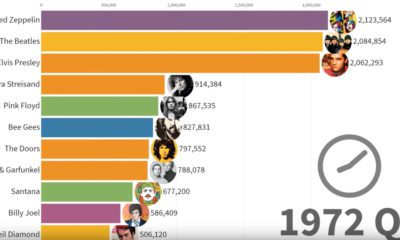
This mesmerizing video visualizes the best-selling music artists from 1969 to 2019 and highlights how long they held onto the top spot.
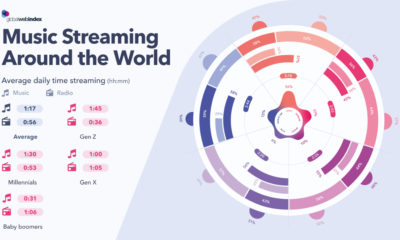
How do people around the world consume their music, and how are these consumption habits changing as technology evolves?
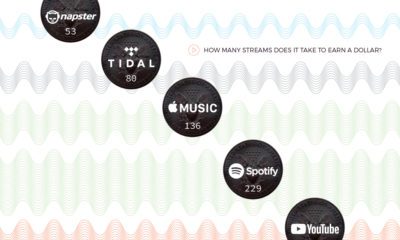
Streaming has breathed new life into the music business, but as new data shows, these services pay out wildly different rates per stream.
A revealing look at three decades of music industry sales. After a devastating decline, streaming services like Spotify are helping the industry regain its footing.
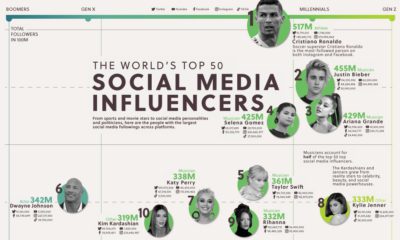
Which influencers have the most total social media followers? We tally up follower counts across all major platforms, from Twitter to TikTok.
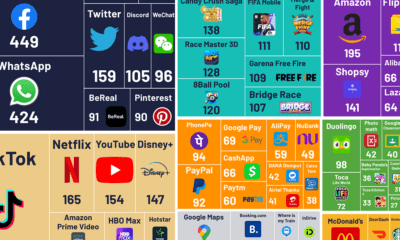
What are the world's most popular apps? This graphic visualizes the most downloaded apps, grouped together by different categories.


 Creator Program