Politics
Visualizing the BRICS Expansion in 4 Charts


Visualizing the BRICS Expansion in 4 Charts
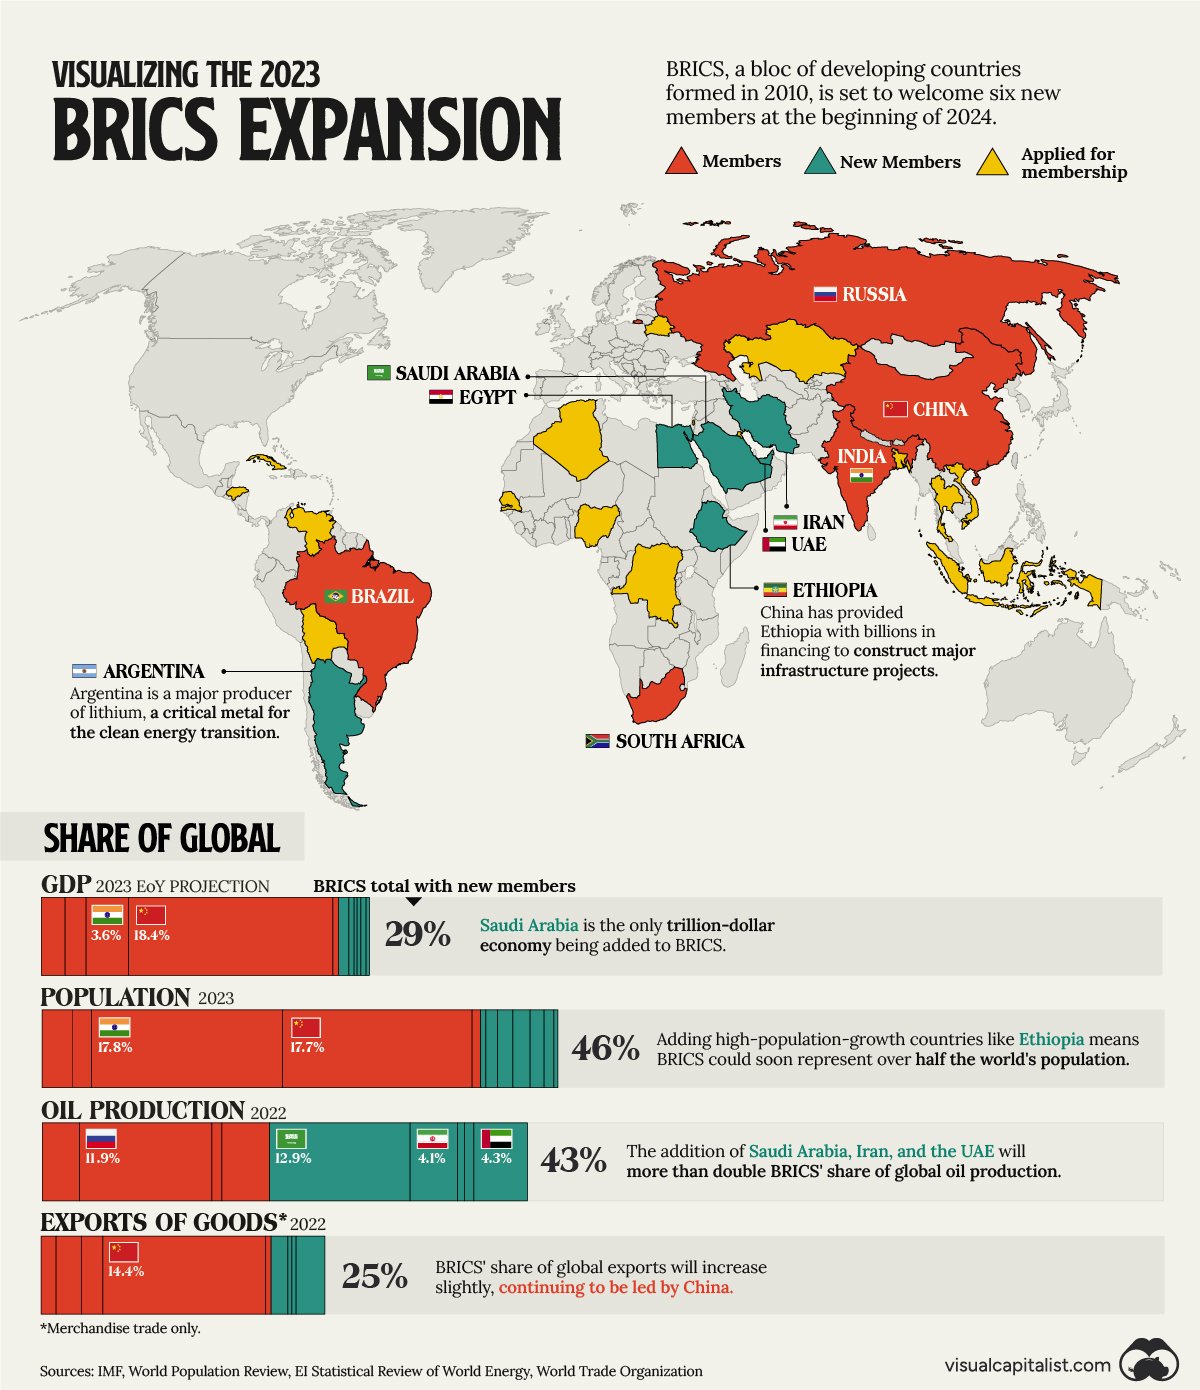
BRICS is an association of five major countries including Brazil, Russia, India, China, and South Africa. Distinguished by their emerging economies, the group has sought to improve diplomatic coordination, reform global financial institutions, and ultimately serve as a counterbalance to Western hegemony.
On Aug. 24, 2023, BRICS announced that it would formally accept six new members at the start of 2024: Saudi Arabia, Iran, Ethiopia, Egypt, Argentina, and the United Arab Emirates (UAE).
In this graphic, we provide a data-driven overview of how the BRICS expansion will grow the group’s influence and reach.
Share of Global GDP
Because most of the new BRICS members are considered to be developing economies, their addition to the group will not have a major impact on its overall share of GDP.
The following table includes GDP projections for 2023, courtesy of the IMF.
| Original BRICS Member | Country | GDP (USD billions) | Share of Global (%) |
|---|---|---|---|
| Yes | 🇧🇷 Brazil | $2,081 | 2.0% |
| Yes | 🇷🇺 Russia | $2,063 | 2.0% |
| Yes | 🇮🇳 India | $3,737 | 3.6% |
| Yes | 🇨🇳 China | $19,374 | 18.4% |
| Yes | 🇿🇦 South Africa | $399 | 0.4% |
| No | 🇸🇦 Saudi Arabia | $1,062 | 1.0% |
| No | 🇮🇷 Iran | $368 | 0.4% |
| No | 🇪🇹 Ethiopia | $156 | 0.1% |
| No | 🇪🇬 Egypt | $387 | 0.4% |
| No | 🇦🇷 Argentina | $641 | 0.6% |
| No | 🇦🇪 UAE | $499 | 0.5% |
| - | BRICS Total | $30,767 | 29.3% |
| - | Rest of World | $74,362 | 70.7% |
The original six BRICS members are expected to have a combined GDP of $27.6 trillion in 2023, representing 26.3% of the global total. With the new members included, expected GDP climbs slightly to $30.8 trillion, enough for a 29.3% global share.
Share of Global Population
BRICS has always represented a major chunk of global population thanks to China and India, which are the only countries with over 1 billion people.
The two biggest populations being added to BRICS are Ethiopia (126.5 million) and Egypt (112.7 million). See the following table for population data from World Population Review, which is dated as of 2023.
| Original BRICS Member | Country | Population | Share of Global (%) |
|---|---|---|---|
| Yes | 🇧🇷 Brazil | 216,422,446 | 2.7% |
| Yes | 🇷🇺 Russia | 144,444,359 | 1.8% |
| Yes | 🇮🇳 India | 1,428,627,663 | 17.8% |
| Yes | 🇨🇳 China | 1,425,671,352 | 17.7% |
| Yes | 🇿🇦 South Africa | 60,414,495 | 0.8% |
| No | 🇸🇦 Saudi Arabia | 36,947,025 | 0.5% |
| No | 🇮🇷 Iran | 89,172,767 | 1.1% |
| No | 🇪🇹 Ethiopia | 126,527,060 | 1.6% |
| No | 🇪🇬 Egypt | 112,716,598 | 1.4% |
| No | 🇦🇷 Argentina | 45,773,884 | 0.6% |
| No | 🇦🇪 UAE | 9,516,871 | 0.1% |
| - | BRICS Total | 3.7 billion | 46.0% |
| - | Rest of World | 4.3 billion | 54.0% |
It’s possible that BRICS could eventually surpass 50% of global population, as many more countries have expressed their desire to join.
Share of Oil Production
Although the world is trying to move away from fossil fuels, the global oil market is still incredibly large—and BRICS is set to play a much bigger role in it. This is mostly due to the admission of Saudi Arabia, which alone accounts for 12.9% of global oil production.
Based on 2022 figures from the Energy Institute Statistical Review of World Energy, BRICS’ share of oil production will grow from 20.4% to 43.1%.
| Original BRICS Member | Country | Thousand Barrels per Day | Share of Global (%) |
|---|---|---|---|
| Yes | 🇧🇷 Brazil | 3,107 | 3.3% |
| Yes | 🇷🇺 Russia | 11,202 | 11.9% |
| Yes | 🇮🇳 India | 737 | 0.8% |
| Yes | 🇨🇳 China | 4,111 | 4.4% |
| Yes | 🇿🇦 South Africa | 0 | 0.0% |
| No | 🇸🇦 Saudi Arabia | 12,136 | 12.9% |
| No | 🇮🇷 Iran | 3,822 | 4.1% |
| No | 🇪🇹 Ethiopia | 0 | 0.0% |
| No | 🇪🇬 Egypt | 613 | 0.7% |
| No | 🇦🇷 Argentina | 706 | 0.8% |
| No | 🇦🇪 UAE | 4,020 | 4.3% |
| - | BRICS Total | 40,454 | 43.1% |
| - | Rest of World | 53,394 | 56.9% |
It’s worth noting that China has been pushing for oil trade to be denominated in yuan, and that Saudi Arabia’s acceptance into BRICS could bolster this ambition, potentially shifting the dynamics of global oil trade.
Share of Global Exports
The last metric included in our graphic is global exports, which is based on 2022 data from the World Trade Organization. We can see that the BRICS expansion will grow the group’s share of global exports (merchandise trade) to 25.1%, up from 20.2%.
| Original BRICS Member | Country | Exports (USD billions) | Share of Global (%) |
|---|---|---|---|
| Yes | 🇧🇷 Brazil | 334 | 1.3% |
| Yes | 🇷🇺 Russia | 532 | 2.1% |
| Yes | 🇮🇳 India | 453 | 1.8% |
| Yes | 🇨🇳 China | 3,594 | 14.4% |
| Yes | 🇿🇦 South Africa | 123 | 0.5% |
| No | 🇸🇦 Saudi Arabia | 410 | 1.6% |
| No | 🇮🇷 Iran | 73 | 0.3% |
| No | 🇪🇹 Ethiopia | 3.9 | 0.02% |
| No | 🇪🇬 Egypt | 49 | 0.2% |
| No | 🇦🇷 Argentina | 88 | 0.4% |
| No | 🇦🇪 UAE | 599 | 2.4% |
| - | BRICS Total | 6,259 | 25.1% |
| - | Rest of World | 18,646 | 74.9% |
Unsurprisingly, China is the world’s largest exporter. Major exporters that are not a part of BRICS include the U.S. (8.3%), Germany (6.6%), the Netherlands (3.9%), and Japan (3.0%).
Who Else Wants to Join?
According to Reuters, there are over 40 countries that have expressed interest in joining BRICS. A smaller group of 16 countries have actually applied for membership, though, and this list includes Algeria, Cuba, Indonesia, Palestine, and Vietnam.
As the group grows in size, differing opinions and priorities among its members could create tensions in the future. For example, India and China have had numerous border disputes in recent years, while Brazil’s newly elected President has sought to “kickstart a new era of relations” with the U.S.
One thing that is certain, however, is that a new acronym for the group will be needed very soon.


Misc
Visualized: Aircraft Carriers by Country
The U.S. controls 40% of global aircraft carrier fleet.
Visualized: Aircraft Carriers by Country
This was originally posted on our Voronoi app. Download the app for free on iOS or Android and discover incredible data-driven charts from a variety of trusted sources.
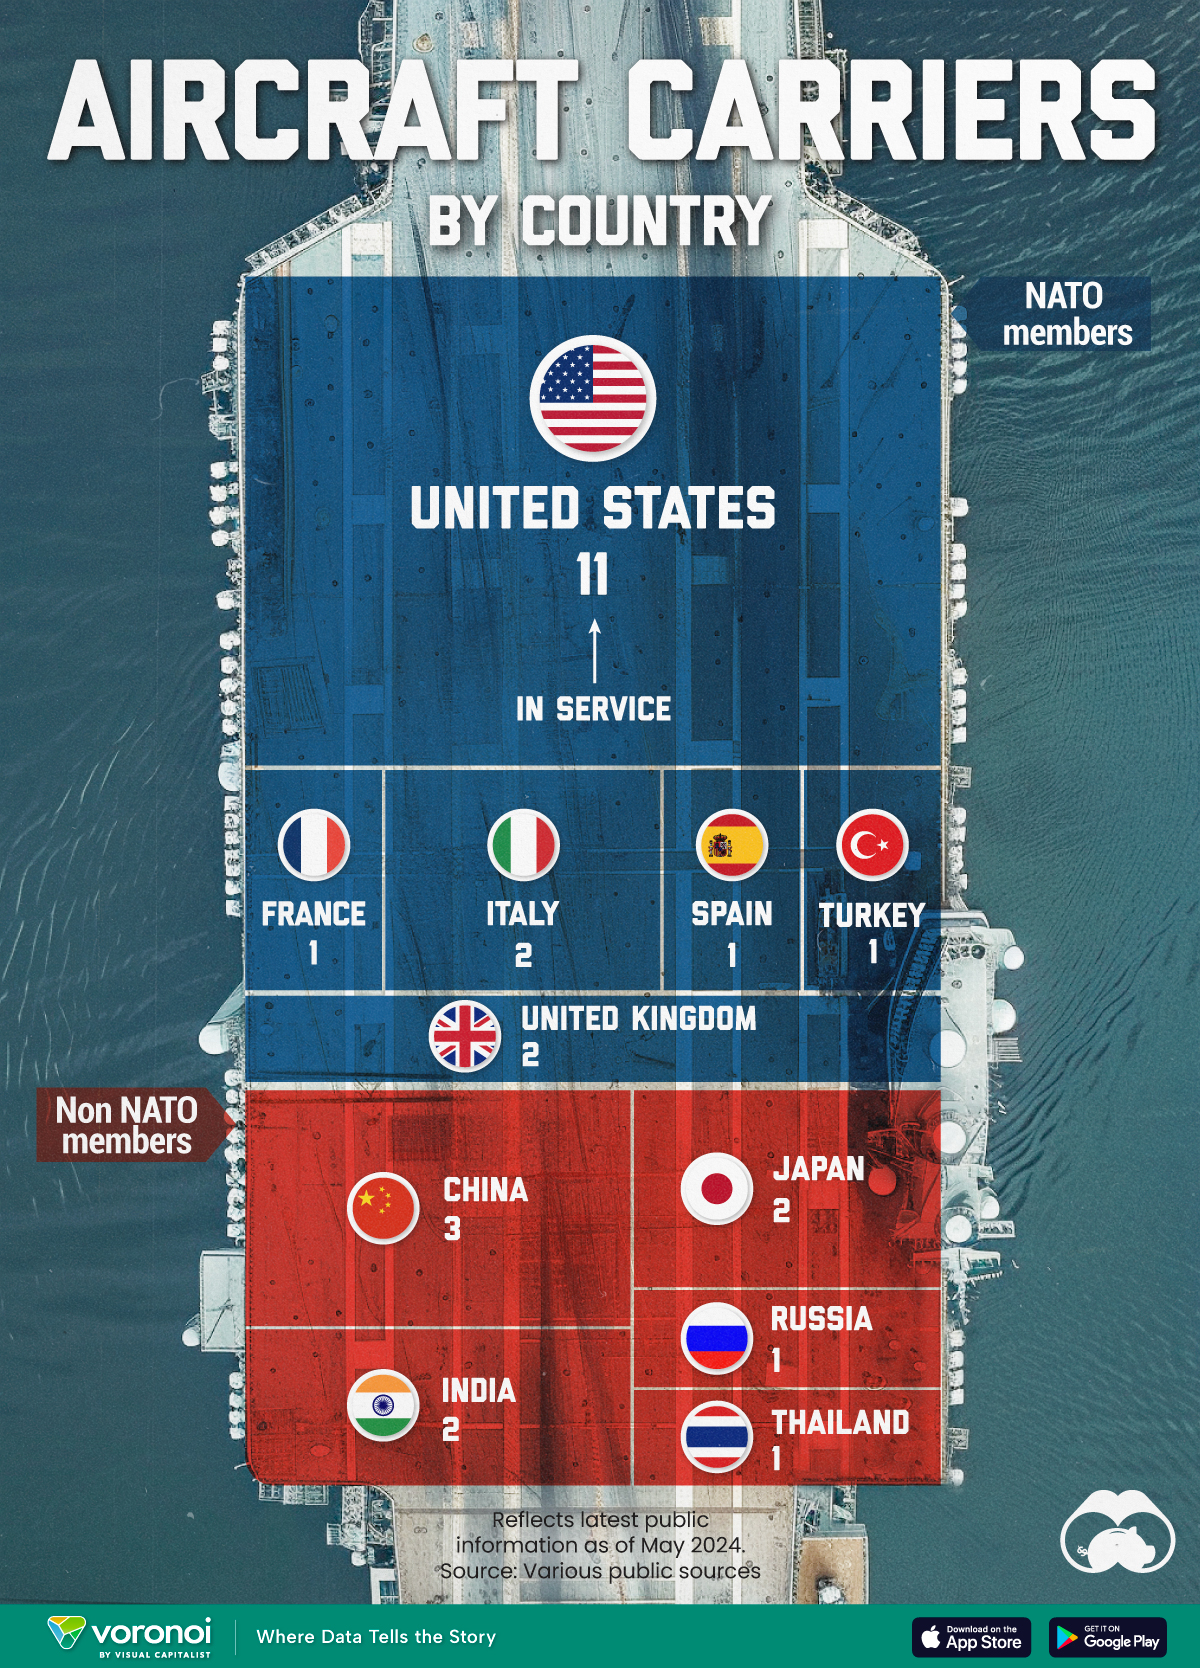
Aircraft carriers are warships equipped with a full-length flight deck for carrying, deploying, and recovering aircraft. Since they allow naval forces to utilize air power without relying on local bases, they usually serve as the capital ships of a fleet.
In this graphic, we visualize the number of aircraft carriers in service by country as of May 2024.
This graphic only includes ships capable of carrying planes (excluding those designed solely for helicopters). The list is based on data from various sources.
U.S. Dominance
The U.S., with 11 aircraft carriers in total, owns 40% of the global fleet. Some of the American carriers can carry around 80 fighters. The country’s total combined deck space is over twice that of all other nations combined.
| Country | In service | NATO Member |
|---|---|---|
| 🇺🇸 United States | 11 | Yes |
| 🇨🇳 China | 3 | No |
| 🇮🇳 India | 2 | No |
| 🇮🇹 Italy | 2 | Yes |
| 🇯🇵 Japan | 2 | No |
| 🇬🇧 United Kingdom | 2 | Yes |
| 🇫🇷 France | 1 | Yes |
| 🇷🇺 Russia | 1 | No |
| 🇪🇸 Spain | 1 | Yes |
| 🇹🇭 Thailand | 1 | No |
| 🇹🇷 Turkey | 1 | Yes |
| Total | 27 |
Along with France, the U.S. is the only nation with nuclear-powered aircraft carriers. These ships can remain at sea for as long as crew provisions last, without the need for refueling.
In 2024, China’s newest, largest, and most advanced aircraft carrier, the Fujian, started sea trials. With the addition of this ship, the country becomes second in our ranking.
Of 11 countries that have aircraft carriers in their fleets, six are NATO members.
Learn More About War Machines from Visual Capitalist
If you enjoyed this post, be sure to check out ‘Visualized: Top 15 Global Tank Fleets.’ This visualization showcases the most powerful tank fleets as of 2024.

-

 Technology6 days ago
Countries With the Highest Rates of Crypto Ownership
-

 Mining2 weeks ago
Visualizing Global Gold Production in 2023
-

 Markets2 weeks ago
Visualized: Interest Rate Forecasts for Advanced Economies
-

 Economy2 weeks ago
The Most Valuable Companies in Major EU Economies
-

 Markets2 weeks ago
The World’s Fastest Growing Emerging Markets (2024-2029 Forecast)
-

 Markets1 week ago
Visualizing Global Inflation Forecasts (2024-2026)
-

 Politics1 week ago
Charted: What Southeast Asia Thinks About China & the U.S.
-

 Misc1 week ago
The Evolution of U.S. Beer Logos