Economy
Visualizing All of China’s Trade Partners
Article/Editing:
Click to view this graphic in a higher-resolution.
Visualizing All of China’s Trade Partners
China stands as a formidable player in the global trade arena, wielding its influence as the world’s largest goods exporter.
With a complex network of trade partnerships spanning more than 200 countries, regions, and territories, the world’s second-largest economy has significant economic relationships with both allies and adversaries.
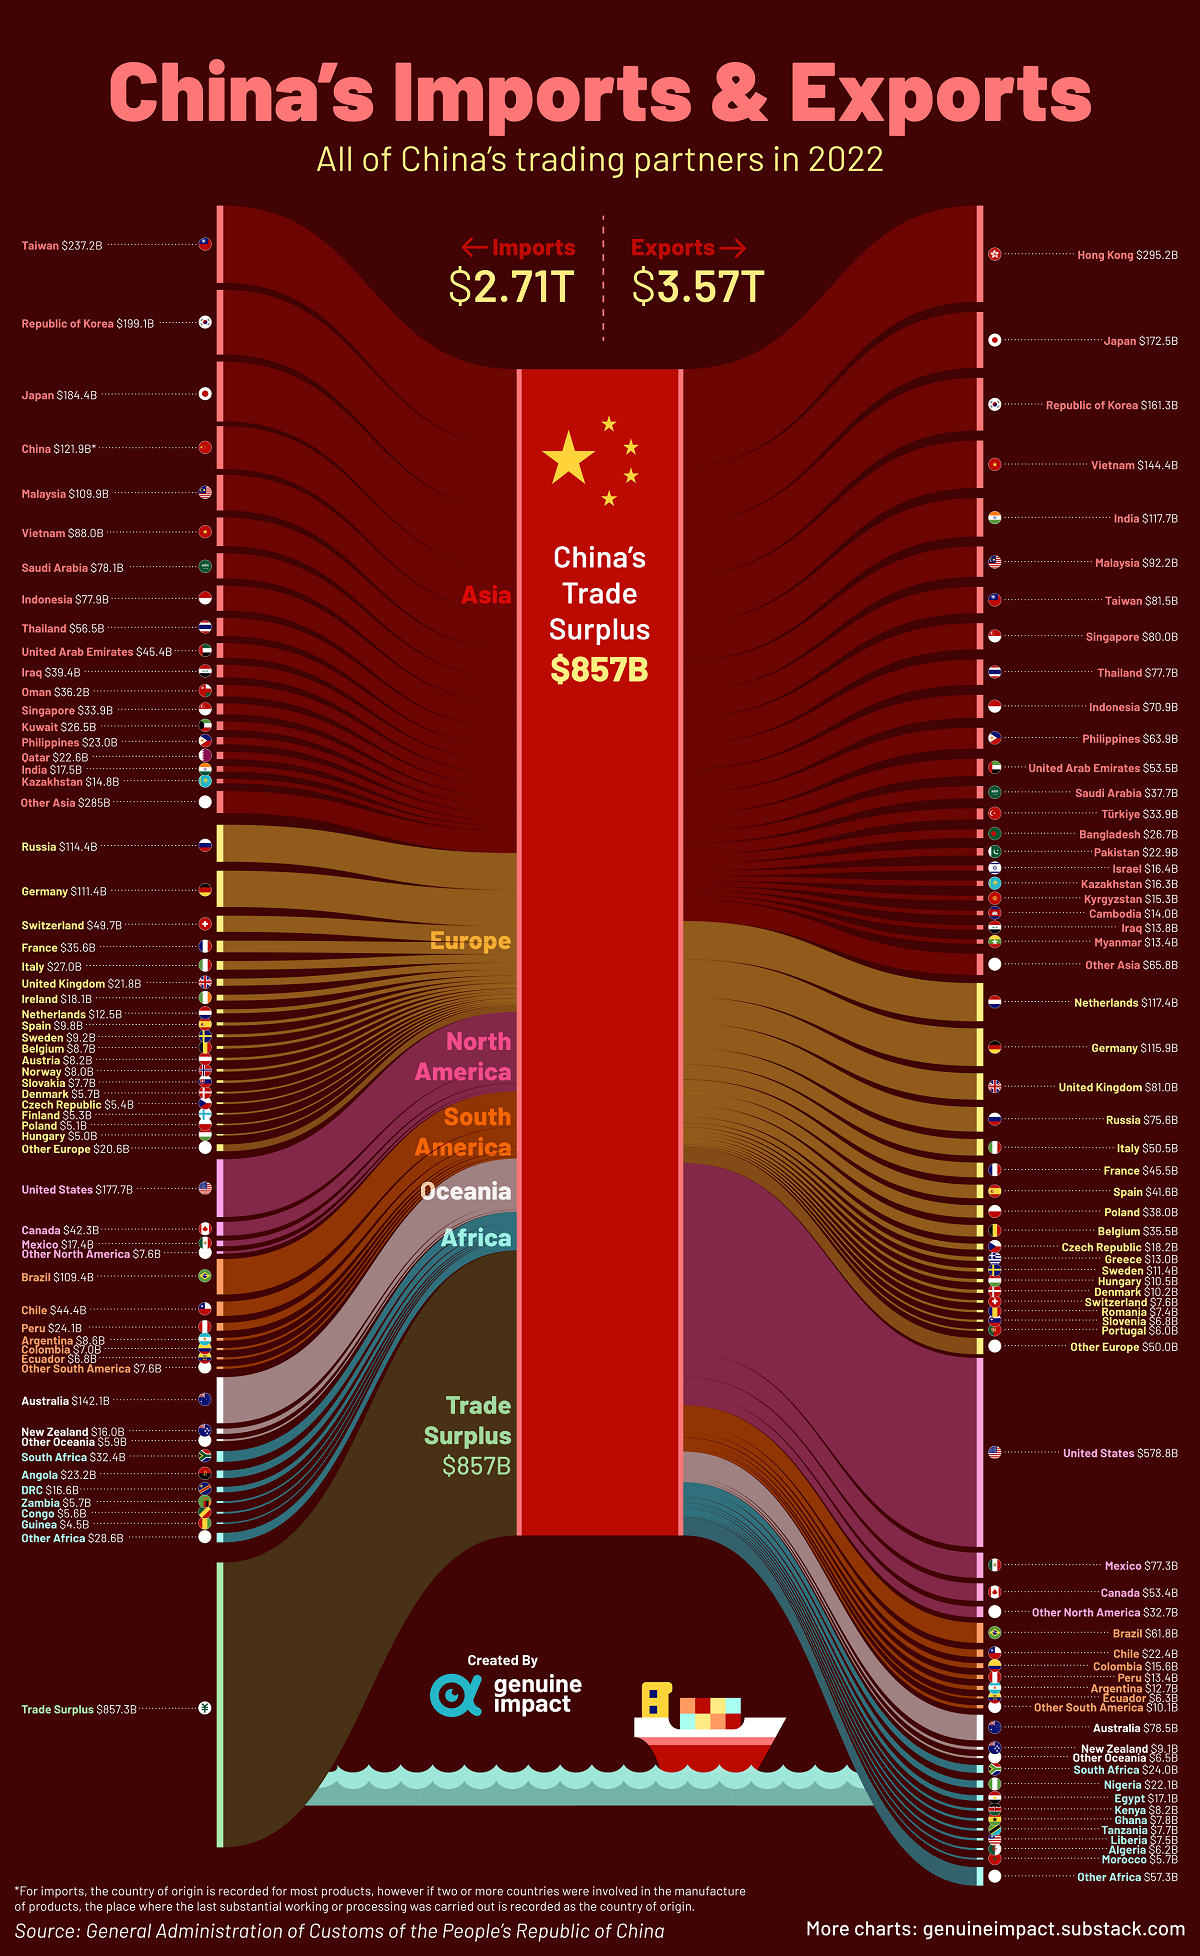
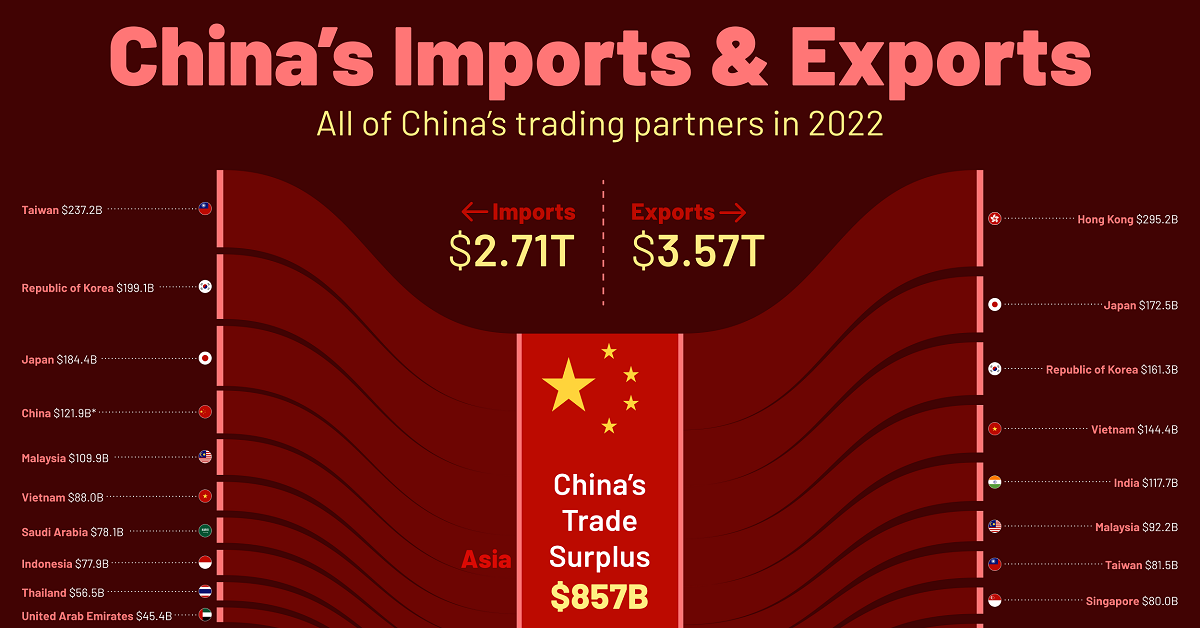
By using 2022 trade data from China’s General Administration of Customs, this visualization from Truman Du breaks down the nation’s top trading partners through imports and exports by destination.
China’s Imports and Exports by Country in 2022
Over the course of 2022, China saw exports totaling $3.57 trillion and imports totaling $2.71 trillion, giving it a massive trade surplus of $857 billion.
| Country | Imports (2022 USD) | Exports (2022 USD) | Balance (2022 USD) |
|---|---|---|---|
| 🇺🇸 United States | $177.7B | $578.8B | +$401.1B |
| 🇭🇰 Hong Kong | $7.8B | $295.2B | +$287.4B |
| 🇳🇱 Netherlands | $12.5B | $117.4B | +$104.9B |
| 🇮🇳 India | $17.5B | $117.7B | +$100.3B |
| 🇲🇽 Mexico | $17.4B | $77.3B | +$59.8B |
| 🇬🇧 United Kingdom | $21.8B | $81.0B | +$59.2B |
| 🇻🇳 Vietnam | $88.0B | $144.4B | +$56.4B |
| 🇸🇬 Singapore | $33.9B | $80.0B | +$46.1B |
| 🇵🇭 Philippines | $23.0B | $63.9B | +$40.9B |
| 🇵🇱 Poland | $5.1B | $38.0B | +$32.9B |
| 🇪🇸 Spain | $9.8B | $41.6B | +$31.9B |
| 🇹🇷 Türkiye | $4.5B | $33.9B | +$29.4B |
| 🇧🇪 Belgium | $8.7B | $35.5B | +$26.7B |
| 🇧🇩 Bangladesh | $1.0B | $26.7B | +$25.7B |
| 🇮🇹 Italy | $27.0B | $50.5B | +$23.6B |
| 🇹🇭 Thailand | $56.5B | $77.7B | +$21.1B |
| 🇳🇬 Nigeria | $1.6B | $22.1B | +$20.5B |
| 🇵🇰 Pakistan | $3.4B | $22.9B | +$19.5B |
| 🇪🇬 Egypt | $1.0B | $17.1B | +$16.0B |
| 🇰🇬 Kyrgyzstan | $0.1B | $15.3B | +$15.3B |
| 🇨🇿 Czechia | $5.4B | $18.2B | +$12.8B |
| 🇰🇭 Cambodia | $1.8B | $14.0B | +$12.2B |
| 🇬🇷 Greece | $0.8B | $12.9B | +$12.1B |
| 🇵🇦 Panama | $1.2B | $12.6B | +$11.4B |
| 🇨🇦 Canada | $42.3B | $53.4B | +$11.1B |
| 🇫🇷 France | $35.6B | $45.5B | +$9.9B |
| 🇨🇴 Colombia | $7.0B | $15.5B | +$8.5B |
| 🇦🇪 United Arab Emirates | $45.4B | $53.5B | +$8.1B |
| 🇰🇪 Kenya | $0.3B | $8.2B | +$7.9B |
| 🇱🇷 Liberia | $0.0B | $7.5B | +$7.5B |
| 🇮🇱 Israel | $9.0B | $16.4B | +$7.4B |
| 🇹🇿 Tanzania | $0.5B | $7.7B | +$7.1B |
| 🇸🇮 Slovenia | $0.6B | $6.8B | +$6.3B |
| 🇬🇭 Ghana | $2.3B | $7.8B | +$5.5B |
| 🇭🇺 Hungary | $5.0B | $10.5B | +$5.4B |
| 🇺🇿 Uzbekistan | $2.3B | $7.4B | +$5.1B |
| 🇩🇿 Algeria | $1.1B | $6.2B | +$5.1B |
| 🇯🇴 Jordan | $0.7B | $5.7B | +$4.9B |
| 🇲🇦 Morocco | $0.9B | $5.7B | +$4.8B |
| 🇩🇪 Germany | $111.4B | $115.9B | +$4.5B |
| 🇩🇰 Denmark | $5.7B | $10.2B | +$4.4B |
| 🇷🇴 Romania | $3.1B | $7.4B | +$4.3B |
| 🇦🇷 Argentina | $8.6B | $12.7B | +$4.1B |
| 🇲🇴 Macao | $0.1B | $4.2B | +$4.1B |
| 🇬🇹 Guatemala | $0.6B | $4.3B | +$3.8B |
| 🇩🇴 Dominican Republic | $0.5B | $4.3B | +$3.7B |
| 🇸🇳 Senegal | $0.3B | $4.0B | +$3.7B |
| 🇲🇭 Marshall Islands | $0.0B | $3.5B | +$3.5B |
| 🇱🇰 Sri Lanka | $0.5B | $3.7B | +$3.2B |
| 🇩🇯 Djibouti | $0.1B | $3.2B | +$3.1B |
| 🇮🇷 Iran | $6.4B | $9.4B | +$3.0B |
| 🇹🇬 Togo | $0.2B | $3.1B | +$2.9B |
| 🇵🇹 Portugal | $3.0B | $6.0B | +$2.9B |
| 🇨🇮 Cote d'Ivoire | $1.0B | $3.5B | +$2.5B |
| 🇨🇲 Cameroon | $0.7B | $3.1B | +$2.5B |
| 🇱🇧 Lebanon | $0.1B | $2.5B | +$2.4B |
| 🇸🇪 Sweden | $9.1B | $11.4B | +$2.2B |
| 🇻🇪 Venezuela | $0.8B | $3.0B | +$2.1B |
| 🇾🇪 Yemen | $0.6B | $2.8B | +$2.1B |
| 🇭🇷 Croatia | $0.2B | $2.3B | +$2.1B |
| 🇲🇿 Mozambique | $1.3B | $3.2B | +$1.9B |
| 🇲🇲 Myanmar | $11.5B | $13.4B | +$1.9B |
| 🇹🇯 Tajikistan | $0.4B | $2.2B | +$1.8B |
| 🇵🇾 Paraguay | $0.1B | $1.9B | +$1.8B |
| 🇪🇹 Ethiopia | $0.5B | $2.2B | +$1.8B |
| 🇱🇹 Lithuania | $0.1B | $1.8B | +$1.7B |
| 🇳🇵 Nepal | $0.0B | $1.6B | +$1.6B |
| 🇹🇳 Tunisia | $0.3B | $1.9B | +$1.6B |
| 🇧🇬 Bulgaria | $1.3B | $2.8B | +$1.6B |
| 🇭🇳 Honduras | $0.0B | $1.6B | +$1.5B |
| 🇧🇭 Bahrain | $0.3B | $1.8B | +$1.5B |
| 🇰🇿 Kazakhstan | $14.8B | $16.3B | +$1.5B |
| 🇧🇾 Belarus | $1.8B | $3.2B | +$1.4B |
| 🇧🇯 Benin | $0.3B | $1.7B | +$1.4B |
| 🇸🇻 El Salvador | $0.2B | $1.7B | +$1.4B |
| 🇲🇹 Malta | $0.6B | $2.0B | +$1.4B |
| 🇸🇩 Sudan | $0.9B | $2.0B | +$1.1B |
| 🇨🇾 Cyprus | $0.0B | $1.2B | +$1.1B |
| 🇬🇪 Georgia | $0.1B | $1.2B | +$1.1B |
| 🇸🇴 Somalia | $0.0B | $1.0B | +$1.0B |
| 🇦🇿 Azerbaijan | $0.1B | $1.1B | +$1.0B |
| 🇯🇲 Jamaica | $0.0B | $1.0B | +$1.0B |
| 🇺🇬 Uganda | $0.1B | $1.1B | +$1.0B |
| 🇲🇺 Mauritius | $0.0B | $1.0B | +$0.9B |
| 🇷🇸 Serbia | $1.4B | $2.2B | +$0.8B |
| 🇲🇬 Madagascar | $0.6B | $1.4B | +$0.8B |
| 🇰🇵 Korea, DPR | $0.1B | $0.8B | +$0.7B |
| 🇳🇮 Nicaragua | $0.0B | $0.7B | +$0.7B |
| 🇪🇪 Estonia | $0.3B | $0.9B | +$0.7B |
| 🇱🇻 Latvia | $0.4B | $1.0B | +$0.6B |
| 🇭🇹 Haiti | $0.0B | $0.6B | +$0.6B |
| 🇦🇱 Albania | $0.2B | $0.7B | +$0.5B |
| 🇦🇫 Afghanistan | $0.0B | $0.6B | +$0.5B |
| 🇲🇱 Mali | $0.1B | $0.6B | +$0.5B |
| 🇫🇯 Fiji | $0.0B | $0.5B | +$0.5B |
| 🇲🇻 Maldives | $0.0B | $0.4B | +$0.4B |
| 🇸🇾 Syria | $0.0B | $0.4B | +$0.4B |
| 🇬🇲 Gambia | $0.0B | $0.4B | +$0.4B |
| 🇧🇫 Burkina Faso | $0.1B | $0.5B | +$0.4B |
| 🇧🇸 Bahamas | $0.0B | $0.4B | +$0.4B |
| 🇳🇪 Niger | $0.3B | $0.7B | +$0.4B |
| 🇨🇷 Costa Rica | $2.0B | $2.4B | +$0.4B |
| 🇷🇼 Rwanda | $0.1B | $0.4B | +$0.3B |
| 🇧🇿 Belize | $0.0B | $0.3B | +$0.3B |
| 🇸🇷 Suriname | $0.0B | $0.3B | +$0.3B |
| 🇲🇼 Malawi | $0.0B | $0.3B | +$0.3B |
| 🇷🇪 Réunion | $0.0B | $0.2B | +$0.2B |
| 🇱🇺 Luxembourg | $0.3B | $0.5B | +$0.2B |
| 🇧🇴 Bolivia | $0.9B | $1.1B | +$0.2B |
| 🇲🇪 Montenegro | $0.0B | $0.2B | +$0.2B |
| 🇧🇹 Bhutan | $0.0B | $0.2B | +$0.2B |
| 🇵🇸 Palestine | $0.0B | $0.2B | +$0.2B |
| 🇵🇫 French Polynesia | $0.0B | $0.2B | +$0.1B |
| 🇹🇱 Timor-Leste | $0.1B | $0.3B | +$0.1B |
| 🇧🇧 Barbados | $0.0B | $0.2B | +$0.1B |
| 🇲🇩 Moldova | $0.1B | $0.2B | +$0.1B |
| 🇼🇸 Samoa | $0.0B | $0.1B | +$0.1B |
| 🇮🇸 Iceland | $0.2B | $0.3B | +$0.1B |
| 🇻🇬 British Virgin Islands | $0.0B | $0.1B | +$0.1B |
| 🇧🇮 Burundi | $0.0B | $0.1B | +$0.1B |
| 🌏 Other Oceanian Territories | $0.0B | $0.1B | +$0.1B |
| 🇦🇬 Antigua and Barbuda | $0.0B | $0.1B | +$0.1B |
| 🇸🇨 Seychelles | $0.0B | $0.1B | +$0.1B |
| 🇨🇻 Cabo Verde | $0.0B | $0.1B | +$0.1B |
| 🇻🇺 Vanuatu | $0.0B | $0.1B | +$0.1B |
| 🇧🇲 Bermuda | $0.0B | $0.1B | +$0.1B |
| 🇸🇿 Eswatini | $0.0B | $0.1B | +$0.1B |
| 🇬🇵 Guadeloupe | $0.0B | $0.1B | +$0.1B |
| 🇰🇲 Comoros | $0.0B | $0.1B | +$0.1B |
| 🇦🇼 Aruba | $0.0B | $0.1B | +$0.1B |
| 🇧🇦 Bosnia and Herzegovina | $0.1B | $0.2B | +$0.1B |
| 🇨🇼 Curaçao | $0.0B | $0.1B | +$0.1B |
| 🇾🇹 Mayotte | $0.0B | $0.1B | +$0.1B |
| 🇬🇼 Guinea-Bissau | $0.0B | $0.1B | +$0.1B |
| 🇹🇴 Tonga | $0.0B | $0.1B | +$0.1B |
| 🇲🇰 North Macedonia | $0.2B | $0.2B | +$0.1B |
| 🇰🇾 Cayman Islands | $0.0B | $0.1B | +$0.1B |
| 🌎 Other Latin American Territories | $0.0B | $0.1B | +$0.1B |
| 🇵🇼 Palau | $0.0B | $0.1B | +$0.1B |
| 🇲🇶 Martinique | $0.0B | $0.0B | +$0.0B |
| 🇰🇮 Kiribati | $0.0B | $0.0B | +$0.0B |
| 🇬🇫 French Guiana | $0.0B | $0.0B | +$0.0B |
| 🇱🇸 Lesotho | $0.0B | $0.1B | +$0.0B |
| 🇱🇨 Saint Lucia | $0.0B | $0.0B | +$0.0B |
| 🇩🇲 Dominica | $0.0B | $0.0B | +$0.0B |
| 🇹🇻 Tuvalu | $0.0B | $0.0B | +$0.0B |
| 🇫🇲 Federated States of Micronesia | $0.0B | $0.0B | +$0.0B |
| 🇨🇫 Central African Republic | $0.0B | $0.1B | +$0.0B |
| 🇧🇶 Bonaire, Sint Eustatius, and Saba | $0.0B | $0.0B | +$0.0B |
| 🇬🇩 Grenada | $0.0B | $0.0B | +$0.0B |
| 🇦🇩 Andorra | $0.0B | $0.0B | +$0.0B |
| 🇻🇨 Saint Vincent and the Grenadines | $0.0B | $0.0B | +$0.0B |
| 🇬🇮 Gibraltar | $0.0B | $0.0B | +$0.0B |
| 🇸🇹 Sao Tome and Principe | $0.0B | $0.0B | +$0.0B |
| 🌍 Other European Territories | $0.0B | $0.0B | +$0.0B |
| 🇰🇳 Saint Kitts and Nevis | $0.0B | $0.0B | +$0.0B |
| 🇳🇷 Nauru | $0.0B | $0.0B | +$0.0B |
| 🇨🇰 Cook Islands | $0.0B | $0.0B | +$0.0B |
| 🇹🇨 Turks and Caicos Islands | $0.0B | $0.0B | +$0.0B |
| 🇲🇫 Saint Martin | $0.0B | $0.0B | +$0.0B |
| 🌏 Other North American Territories | $0.0B | $0.0B | +$0.0B |
| 🇸🇲 San Marino | $0.0B | $0.0B | +$0.0B |
| 🌍 Other African Territories | $0.0B | $0.0B | +$0.0B |
| 🇮🇨 Canary Islands | $0.0B | $0.0B | +$0.0B |
| 🇼🇫 Wallis and Futuna | $0.0B | $0.0B | +$0.0B |
| 🇳🇫 Norfolk Island | $0.0B | $0.0B | +$0.0B |
| 🇪🇭 Western Sahara | $0.0B | $0.0B | +$0.0B |
| 🌏 Other Asian Territories | $0.0B | $0.0B | +$0.0B |
| 🇲🇸 Montserrat | $0.0B | $0.0B | +$0.0B |
| 🇪🇺 Ceuta | $0.0B | $0.0B | +$0.0B |
| 🇻🇦 Holy See | $0.0B | $0.0B | +$0.0B |
| 🇪🇺 Melilla | $0.0B | $0.0B | +$0.0B |
| 🇵🇲 Saint Pierre and Miquelon | $0.0B | $0.0B | +$0.0B |
| 🇧🇶 Bonaire | $0.0B | $0.0B | +$0.0B |
| 🇲🇨 Monaco | $0.0B | $0.0B | -$0.0B |
| 🇨🇺 Cuba | $0.5B | $0.4B | -$0.0B |
| 🇳🇦 Namibia | $0.6B | $0.6B | -$0.0B |
| 🇸🇸 South Sudan | $0.2B | $0.2B | -$-0.1B |
| 🇸🇧 Solomon Islands | $0.3B | $0.2B | -$-0.1B |
| 🇫🇴 Faroe Islands | $0.1B | $0.0B | -$-0.1B |
| 🇱🇮 Liechtenstein | $0.2B | $0.1B | -$-0.1B |
| 🇧🇼 Botswana | $0.4B | $0.2B | -$-0.2B |
| 🇿🇼 Zimbabwe | $1.3B | $1.1B | -$-0.2B |
| 🇸🇱 Sierra Leone | $0.8B | $0.6B | -$-0.2B |
| 🇹🇹 Trinidad and Tobago | $0.8B | $0.5B | -$-0.2B |
| 🇲🇷 Mauritania | $1.2B | $0.9B | -$-0.2B |
| 🇦🇲 Armenia | $0.8B | $0.5B | -$-0.3B |
| 🇪🇷 Eritrea | $0.5B | $0.1B | -$-0.3B |
| 🇵🇷 Puerto Rico | $1.3B | $1.0B | -$-0.3B |
| 🇬🇱 Greenland | $0.4B | $0.0B | -$-0.4B |
| 🇪🇨 Ecuador | $6.8B | $6.3B | -$-0.6B |
| 🇱🇾 Libya | $2.9B | $2.4B | -$-0.6B |
| 🇫🇮 Finland | $5.3B | $4.5B | -$-0.7B |
| 🇬🇾 Guyana | $1.3B | $0.6B | -$-0.7B |
| 🇹🇩 Chad | $1.1B | $0.3B | -$-0.8B |
| 🇺🇦 Ukraine | $4.3B | $3.3B | -$-1.1B |
| 🇱🇦 Laos | $3.4B | $2.3B | -$-1.1B |
| 🇬🇶 Equatorial Guinea | $1.5B | $0.2B | -$-1.3B |
| 🌏 Unknown Countries (Territories) | $1.4B | $0.0B | -$-1.4B |
| 🇧🇳 Brunei | $2.2B | $0.8B | -$-1.4B |
| 🇺🇾 Uruguay | $4.5B | $3.0B | -$-1.5B |
| 🇳🇨 New Caledonia | $1.9B | $0.2B | -$-1.7B |
| 🇬🇳 Guinea | $4.5B | $2.3B | -$-2.3B |
| 🇵🇬 Papua New Guinea | $3.8B | $1.4B | -$-2.4B |
| 🇳🇴 Norway | $8.0B | $5.2B | -$-2.8B |
| 🇦🇹 Austria | $8.2B | $5.1B | -$-3.1B |
| 🇸🇰 Slovakia | $7.7B | $4.4B | -$-3.3B |
| 🇬🇦 Gabon | $3.9B | $0.6B | -$-3.4B |
| 🇨🇬 Congo | $5.6B | $1.0B | -$-4.6B |
| 🇿🇲 Zambia | $5.7B | $1.0B | -$-4.8B |
| 🇲🇳 Mongolia | $9.3B | $2.9B | -$-6.5B |
| 🇳🇿 New Zealand | $16.0B | $9.1B | -$-6.8B |
| 🇮🇩 Indonesia | $77.9B | $70.9B | -$-7.0B |
| 🇿🇦 South Africa | $32.4B | $24.0B | -$-8.4B |
| 🇹🇲 Turkmenistan | $10.3B | $0.9B | -$-9.5B |
| 🇵🇪 Peru | $24.1B | $13.4B | -$-10.7B |
| 🇨🇩 Democratic Republic of Congo | $16.6B | $5.1B | -$-11.5B |
| 🇯🇵 Japan | $184.4B | $172.5B | -$-11.9B |
| 🇮🇪 Ireland | $18.1B | $5.7B | -$-12.4B |
| 🇲🇾 Malaysia | $109.9B | $92.2B | -$-17.7B |
| 🇶🇦 Qatar | $22.6B | $3.9B | -$-18.6B |
| 🇦🇴 Angola | $23.2B | $4.0B | -$-19.2B |
| 🇰🇼 Kuwait | $26.5B | $4.9B | -$-21.6B |
| 🇨🇱 Chile | $44.4B | $22.4B | -$-22.0B |
| 🇮🇶 Iraq | $39.4B | $13.8B | -$-25.6B |
| 🇴🇲 Oman | $36.2B | $4.2B | -$-32.1B |
| 🇰🇷 Republic of Korea | $199.1B | $161.3B | -$-37.8B |
| 🇷🇺 Russia | $114.4B | $75.6B | -$-38.7B |
| 🇸🇦 Saudi Arabia | $78.1B | $37.7B | -$-40.4B |
| 🇨🇭 Switzerland | $49.7B | $7.6B | -$-42.1B |
| 🇧🇷 Brazil | $109.4B | $61.8B | -$-47.6B |
| 🇦🇺 Australia | $142.1B | $78.5B | -$-63.6B |
| 🇨🇳 China | $121.9B | N/A | -$-121.9B |
| 🇹🇼 Taiwan | $237.2B | $81.5B | -$-155.8B |
China had individual trade surpluses with the overwhelming majority of its trade partners: 174 of the 234 countries and territories listed.
These trade surpluses are especially visible in China’s trade relationships with many of the world’s largest economies, including the U.S. and India, with $401.1 billion and $100.3 billion surpluses respectively.
Meanwhile, a good sum of the country’s trade deficits are with major Asian economies. Its largest deficit is with Taiwan, primarily coming from integrated circuit imports. China also has deficits with Japan (-$11.9 billion) and South Korea (-$37.8 billion), the region’s second and fourth-largest economies respectively, largely due to electronics and machinery imports.
The country’s other trade deficits stem from fulfilling strategic needs. For example, China has deficits with oil-producing countries like Russia and Saudi Arabia. It also has a trade deficit with Australia, a key supplier of raw goods such as iron, gold, lithium, and liquefied petroleum gas.
China’s Evolving Trade Partner Relationships
China’s trade relationships extend far beyond just economic considerations; they reflect historical, geopolitical, and strategic factors as well.
Taiwan’s major role in the semiconductor market, for example, makes it both a valuable trade partner and a contentious rival. China considers Taiwan a part of its territory, while Taiwan operates as a separate, self-governed entity.
Likewise, China’s increasing investments in infrastructure across parts of Asia and Africa are starting to reflect growing trade balances with developing countries set to become major trade partners in the future.
As the Chinese economy evolves (and potentially weakens), its relationships with both allies and potential enemies may only grow more complex.

This article was published as a part of Visual Capitalist's Creator Program, which features data-driven visuals from some of our favorite Creators around the world.


Misc
The Top 25 Nationalities of U.S. Immigrants
Mexico is the largest source of immigrants to the U.S., with almost 11 million immigrants.


The Top 25 Nationalities of U.S. Immigrants
This was originally posted on our Voronoi app. Download the app for free on iOS or Android and discover incredible data-driven charts from a variety of trusted sources.
The United States is home to more than 46 million immigrants, constituting approximately 14% of its total population.
This graphic displays the top 25 countries of origin for U.S. immigrants, based on 2022 estimates. The data is sourced from the Migration Policy Institute (MPI), which analyzed information from the U.S. Census Bureau’s 2022 American Community Survey.
In this context, “immigrants” refer to individuals residing in the United States who were not U.S. citizens at birth.
Mexico Emerges as a Leading Source of Immigration
Mexico stands out as the largest contributor to U.S. immigration due to its geographical proximity and historical ties.
Various economic factors, including wage disparities and employment opportunities, motivate many Mexicans to seek better prospects north of the border.
| Country | Region | # of Immigrants |
|---|---|---|
| 🇲🇽 Mexico | Latin America & Caribbean | 10,678,502 |
| 🇮🇳 India | Asia | 2,839,618 |
| 🇨🇳 China | Asia | 2,217,894 |
| 🇵🇭 Philippines | Asia | 1,982,333 |
| 🇸🇻 El Salvador | Latin America & Caribbean | 1,407,622 |
| 🇻🇳 Vietnam | Asia | 1,331,192 |
| 🇨🇺 Cuba | Latin America & Caribbean | 1,312,510 |
| 🇩🇴 Dominican Republic | Latin America & Caribbean | 1,279,900 |
| 🇬🇹 Guatemala | Latin America & Caribbean | 1,148,543 |
| 🇰🇷 Korea | Asia | 1,045,100 |
| 🇨🇴 Colombia | Latin America & Caribbean | 928,053 |
| 🇭🇳 Honduras | Latin America & Caribbean | 843,774 |
| 🇨🇦 Canada | Northern America | 821,322 |
| 🇯🇲 Jamaica | Latin America & Caribbean | 804,775 |
| 🇭🇹 Haiti | Latin America & Caribbean | 730,780 |
| 🇬🇧 United Kingdom | Europe | 676,652 |
| 🇻🇪 Venezuela | Latin America & Caribbean | 667,664 |
| 🇧🇷 Brazil | Latin America & Caribbean | 618,525 |
| 🇩🇪 Germany | Europe | 537,484 |
| 🇪🇨 Ecuador | Latin America & Caribbean | 518,287 |
| 🇵🇪 Peru | Latin America & Caribbean | 471,988 |
| 🇳🇬 Nigeria | Africa | 448,405 |
| 🇺🇦 Ukraine | Europe | 427,163 |
| 🇮🇷 Iran | Middle East | 407,283 |
| 🇵🇰 Pakistan | Asia | 399,086 |
| Rest of World | 11,637,634 | |
| Total | 46,182,089 |
Mexicans are followed in this ranking by Indians, Chinese, and Filipinos, though most immigrants on this list come from countries in the Latin American and Caribbean region.
On the other hand, only three European countries are among the top sources of U.S. immigrants: the UK, Germany, and Ukraine.
Immigration continues to be a significant factor contributing to the overall growth of the U.S. population. Overall population growth has decelerated over the past decade primarily due to declining birth rates.
Between 2021 and 2022, the increase in the immigrant population accounted for 65% of the total population growth in the U.S., representing 912,000 individuals out of nearly 1.4 million.
If you enjoyed this post, be sure to check out Visualized: Why Do People Immigrate to the U.S.? This visualization shows the different reasons cited by new arrivals to America in 2021.

-

 Personal Finance1 week ago
Visualizing the Tax Burden of Every U.S. State
-

 Misc7 days ago
Visualized: Aircraft Carriers by Country
-

 Culture1 week ago
How Popular Snack Brand Logos Have Changed
-

 Mining1 week ago
Visualizing Copper Production by Country in 2023
-

 Misc1 week ago
Charted: How Americans Feel About Federal Government Agencies
-

 Healthcare1 week ago
Which Countries Have the Highest Infant Mortality Rates?
-

 Demographics1 week ago
Mapped: U.S. Immigrants by Region
-

 Maps1 week ago
Mapped: Southeast Asia’s GDP Per Capita, by Country