Misc
Which College Degrees Get the Highest Salaries?
Which College Degrees Get the Highest Salaries?
If you’re a college graduate, you likely went to school to pursue an important passion of yours.
But as we all know, what we major in has consequences that extend far beyond the foundation of knowledge we build in our early years. Any program we choose to enroll in also sets up a track to meet future friends, career opportunities, and connections.
Even further, the college degree you choose will partially dictate your future earning potential – especially in the first decade after school. If jobs in your field are in high demand, it can even set you up for long-term financial success, enabling you to pay off costly student loans and build up savings potential.
Data Backgrounder
Today’s chart comes to us from Reddit user /r/SportsAnalyticsGuy, and it’s based on PayScale’s year-long survey of 1.2 million users that graduated only with a bachelor degree in the United States. You can access the full set of data here.
The data covers two different salary categories:
Starting median salary: The median of what people were earning after they graduated with their degree.
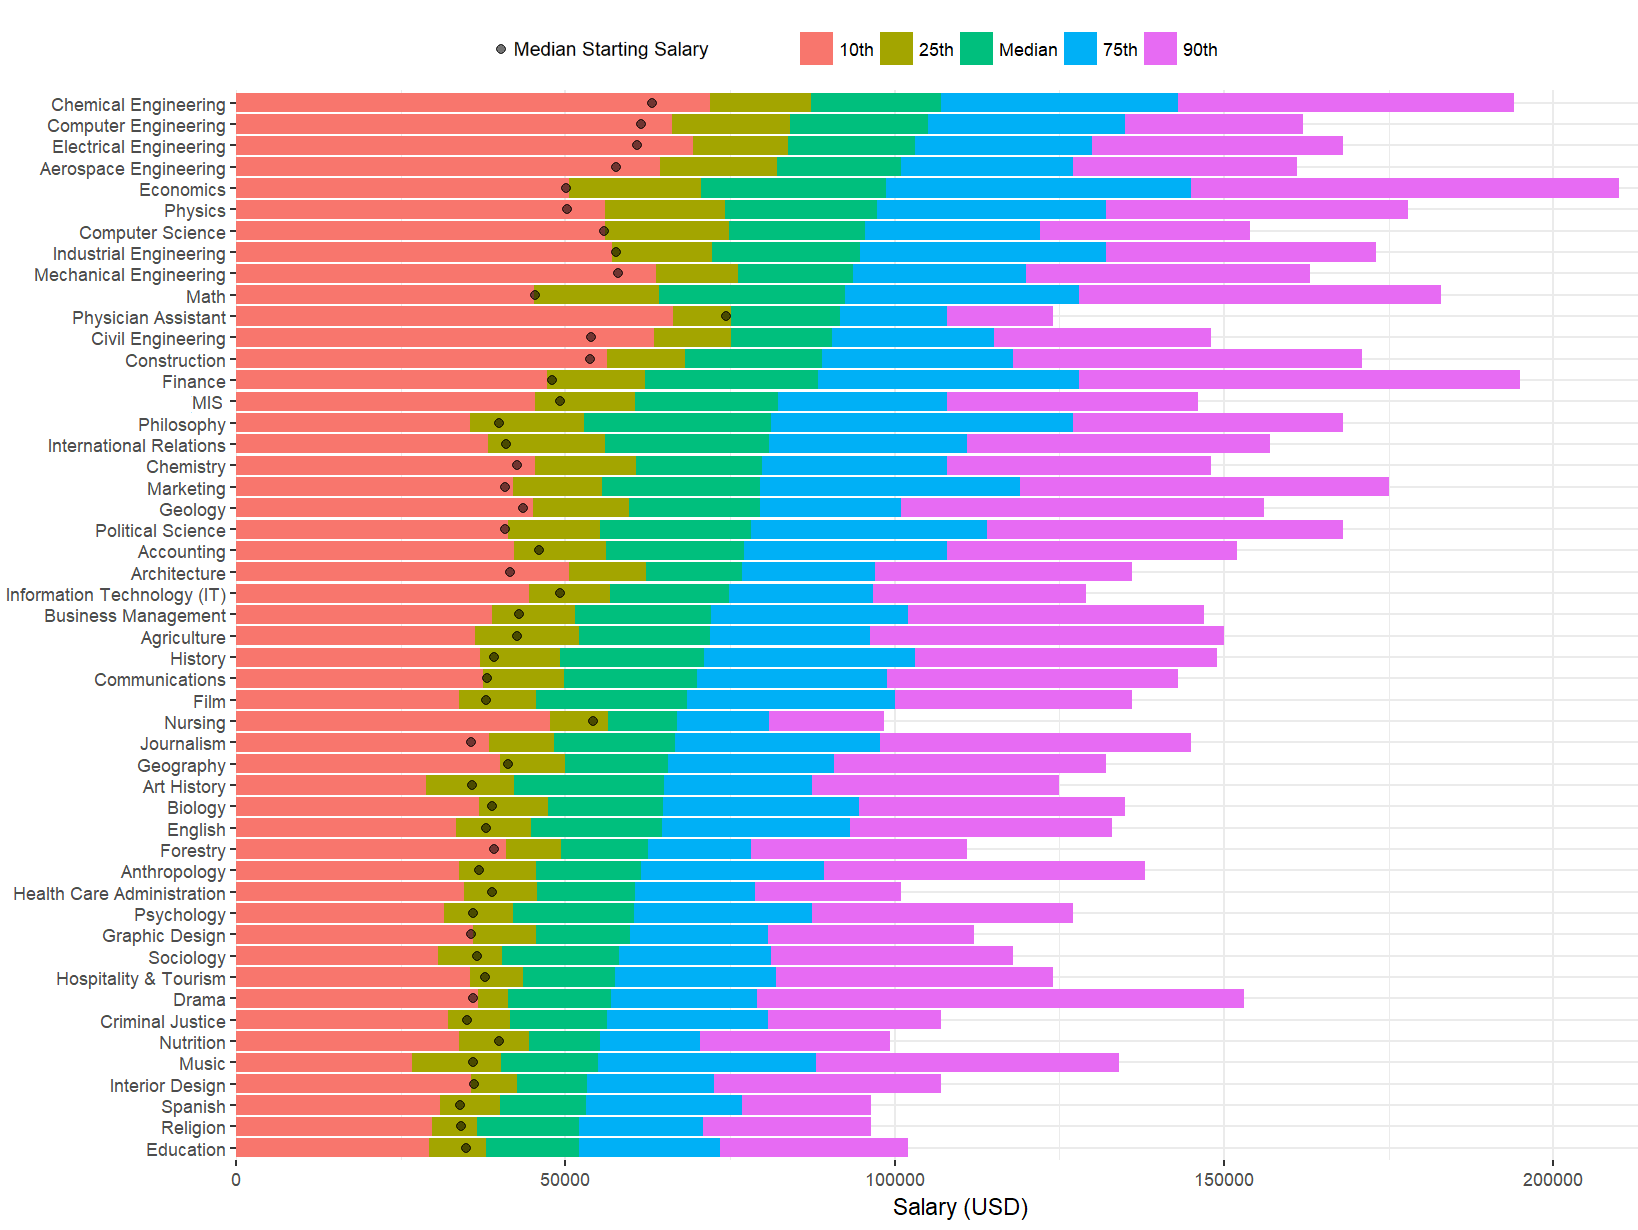
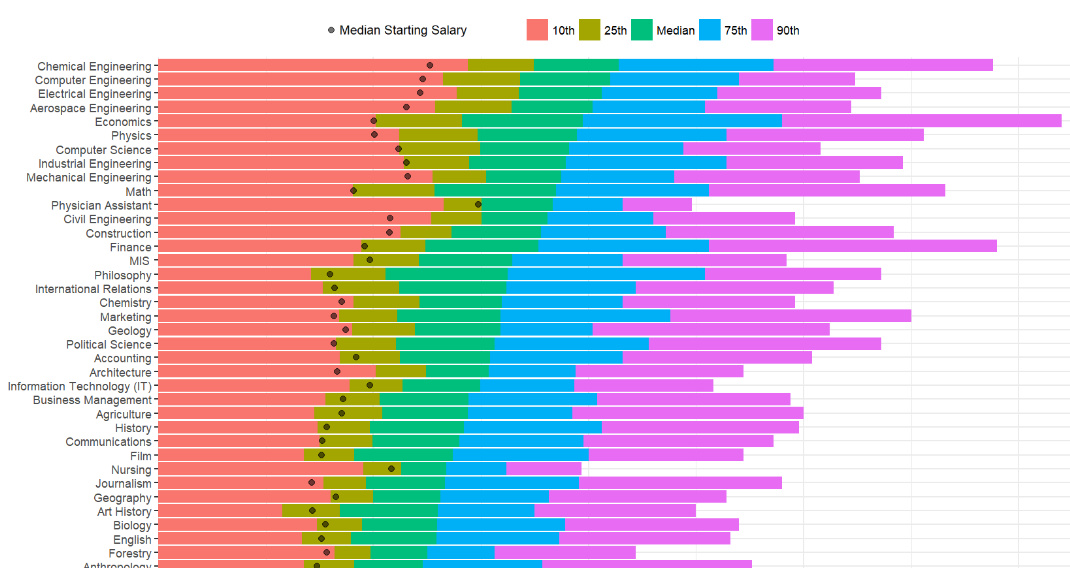
Mid-career Percentiles: Salary data from 10 years after graduation, sorted by percentile (10th, 25th, Median, 75th, and 90th)
In other words, the starting median salary represents what people started making after they graduated, and the rest of the chart depicts the range that people were making 10 years after they got their degree. Lower earners (10th percentile) are the lower bound, and higher earners (90th) are the upper bound.
College Degrees, by Salary
What college majors win out?
Here’s all 50 majors from the data set, sorted by mid-career median salary (10 years in):
| Rank | Undergraduate Major | Starting Median | Mid-Career Median | % Change |
|---|---|---|---|---|
| #1 | Chemical Engineering | $63,200 | $107,000 | 69.3% |
| #2 | Computer Engineering | $61,400 | $105,000 | 71.0% |
| #3 | Electrical Engineering | $60,900 | $103,000 | 69.1% |
| #4 | Aerospace Engineering | $57,700 | $101,000 | 75.0% |
| #5 | Economics | $50,100 | $98,600 | 96.8% |
| #6 | Physics | $50,300 | $97,300 | 93.4% |
| #7 | Computer Science | $55,900 | $95,500 | 70.8% |
| #8 | Industrial Engineering | $57,700 | $94,700 | 64.1% |
| #9 | Mechanical Engineering | $57,900 | $93,600 | 61.7% |
| #10 | Math | $45,400 | $92,400 | 103.5% |
| #11 | Physician Assistant | $74,300 | $91,700 | 23.4% |
| #12 | Civil Engineering | $53,900 | $90,500 | 67.9% |
| #13 | Construction | $53,700 | $88,900 | 65.5% |
| #14 | Finance | $47,900 | $88,300 | 84.3% |
| #15 | Management Information Systems (MIS) | $49,200 | $82,300 | 67.3% |
| #16 | Philosophy | $39,900 | $81,200 | 103.5% |
| #17 | International Relations | $40,900 | $80,900 | 97.8% |
| #18 | Chemistry | $42,600 | $79,900 | 87.6% |
| #19 | Marketing | $40,800 | $79,600 | 95.1% |
| #20 | Geology | $43,500 | $79,500 | 82.8% |
| #21 | Political Science | $40,800 | $78,200 | 91.7% |
| #22 | Accounting | $46,000 | $77,100 | 67.6% |
| #23 | Architecture | $41,600 | $76,800 | 84.6% |
| #24 | Information Technology (IT) | $49,100 | $74,800 | 52.3% |
| #25 | Business Management | $43,000 | $72,100 | 67.7% |
| #26 | Agriculture | $42,600 | $71,900 | 68.8% |
| #27 | History | $39,200 | $71,000 | 81.1% |
| #28 | Communications | $38,100 | $70,000 | 83.7% |
| #29 | Film | $37,900 | $68,500 | 80.7% |
| #30 | Nursing | $54,200 | $67,000 | 23.6% |
| #31 | Journalism | $35,600 | $66,700 | 87.4% |
| #32 | Geography | $41,200 | $65,500 | 59.0% |
| #33 | Art History | $35,800 | $64,900 | 81.3% |
| #34 | Biology | $38,800 | $64,800 | 67.0% |
| #35 | English | $38,000 | $64,700 | 70.3% |
| #36 | Forestry | $39,100 | $62,600 | 60.1% |
| #37 | Anthropology | $36,800 | $61,500 | 67.1% |
| #38 | Health Care Administration | $38,800 | $60,600 | 56.2% |
| #39 | Psychology | $35,900 | $60,400 | 68.2% |
| #40 | Graphic Design | $35,700 | $59,800 | 67.5% |
| #41 | Sociology | $36,500 | $58,200 | 59.5% |
| #42 | Hospitality & Tourism | $37,800 | $57,500 | 52.1% |
| #43 | Drama | $35,900 | $56,900 | 58.5% |
| #44 | Criminal Justice | $35,000 | $56,300 | 60.9% |
| #45 | Nutrition | $39,900 | $55,300 | 38.6% |
| #46 | Music | $35,900 | $55,000 | 53.2% |
| #47 | Interior Design | $36,100 | $53,200 | 47.4% |
| #48 | Spanish | $34,000 | $53,100 | 56.2% |
| #49 | Education | $34,900 | $52,000 | 49.0% |
| #50 | Religion | $34,100 | $52,000 | 52.5% |
Based on this data, there are a few interesting things to point out.
The top earning specialization out of college is for Physician Assistants, with a median starting salary of $74,300. The downside of this degree is that earning potential levels out quickly, only showing a 23.4% increase in earning power 10 years in.
In contrast, the biggest increases in earning power go to Math, Philosophy, Economics, Marketing, Physics, Political Science, and International Relations majors. All these degrees see a 90% or higher increase from median starting salary to median mid-career salary.
In absolute terms, the majors that saw the highest median mid-career salaries were all along the engineering spectrum: chemical engineering, computer engineering, electrical engineering, and aerospace engineering all came in above $100,000. They also generally had very high starting salaries.
As a final note, it’s important to recognize that this data does not necessarily correlate to today’s degrees or job market. The data set is based on people that graduated at least a decade ago – and therefore, it does not necessarily represent what grads may experience as they are starting their careers today.


Misc
The Top 25 Nationalities of U.S. Immigrants
Mexico is the largest source of immigrants to the U.S., with almost 11 million immigrants.


The Top 25 Nationalities of U.S. Immigrants
This was originally posted on our Voronoi app. Download the app for free on iOS or Android and discover incredible data-driven charts from a variety of trusted sources.
The United States is home to more than 46 million immigrants, constituting approximately 14% of its total population.
This graphic displays the top 25 countries of origin for U.S. immigrants, based on 2022 estimates. The data is sourced from the Migration Policy Institute (MPI), which analyzed information from the U.S. Census Bureau’s 2022 American Community Survey.
In this context, “immigrants” refer to individuals residing in the United States who were not U.S. citizens at birth.
Mexico Emerges as a Leading Source of Immigration
Mexico stands out as the largest contributor to U.S. immigration due to its geographical proximity and historical ties.
Various economic factors, including wage disparities and employment opportunities, motivate many Mexicans to seek better prospects north of the border.
| Country | Region | # of Immigrants |
|---|---|---|
| 🇲🇽 Mexico | Latin America & Caribbean | 10,678,502 |
| 🇮🇳 India | Asia | 2,839,618 |
| 🇨🇳 China | Asia | 2,217,894 |
| 🇵🇭 Philippines | Asia | 1,982,333 |
| 🇸🇻 El Salvador | Latin America & Caribbean | 1,407,622 |
| 🇻🇳 Vietnam | Asia | 1,331,192 |
| 🇨🇺 Cuba | Latin America & Caribbean | 1,312,510 |
| 🇩🇴 Dominican Republic | Latin America & Caribbean | 1,279,900 |
| 🇬🇹 Guatemala | Latin America & Caribbean | 1,148,543 |
| 🇰🇷 Korea | Asia | 1,045,100 |
| 🇨🇴 Colombia | Latin America & Caribbean | 928,053 |
| 🇭🇳 Honduras | Latin America & Caribbean | 843,774 |
| 🇨🇦 Canada | Northern America | 821,322 |
| 🇯🇲 Jamaica | Latin America & Caribbean | 804,775 |
| 🇭🇹 Haiti | Latin America & Caribbean | 730,780 |
| 🇬🇧 United Kingdom | Europe | 676,652 |
| 🇻🇪 Venezuela | Latin America & Caribbean | 667,664 |
| 🇧🇷 Brazil | Latin America & Caribbean | 618,525 |
| 🇩🇪 Germany | Europe | 537,484 |
| 🇪🇨 Ecuador | Latin America & Caribbean | 518,287 |
| 🇵🇪 Peru | Latin America & Caribbean | 471,988 |
| 🇳🇬 Nigeria | Africa | 448,405 |
| 🇺🇦 Ukraine | Europe | 427,163 |
| 🇮🇷 Iran | Middle East | 407,283 |
| 🇵🇰 Pakistan | Asia | 399,086 |
| Rest of World | 11,637,634 | |
| Total | 46,182,089 |
Mexicans are followed in this ranking by Indians, Chinese, and Filipinos, though most immigrants on this list come from countries in the Latin American and Caribbean region.
On the other hand, only three European countries are among the top sources of U.S. immigrants: the UK, Germany, and Ukraine.
Immigration continues to be a significant factor contributing to the overall growth of the U.S. population. Overall population growth has decelerated over the past decade primarily due to declining birth rates.
Between 2021 and 2022, the increase in the immigrant population accounted for 65% of the total population growth in the U.S., representing 912,000 individuals out of nearly 1.4 million.
If you enjoyed this post, be sure to check out Visualized: Why Do People Immigrate to the U.S.? This visualization shows the different reasons cited by new arrivals to America in 2021.

-

 Personal Finance1 week ago
Visualizing the Tax Burden of Every U.S. State
-

 Misc7 days ago
Visualized: Aircraft Carriers by Country
-

 Culture7 days ago
How Popular Snack Brand Logos Have Changed
-

 Mining1 week ago
Visualizing Copper Production by Country in 2023
-

 Misc1 week ago
Charted: How Americans Feel About Federal Government Agencies
-

 Healthcare1 week ago
Which Countries Have the Highest Infant Mortality Rates?
-

 Demographics1 week ago
Mapped: U.S. Immigrants by Region
-

 Maps1 week ago
Mapped: Southeast Asia’s GDP Per Capita, by Country