Markets
Ranked: Top TV Advertising Spenders in 2023

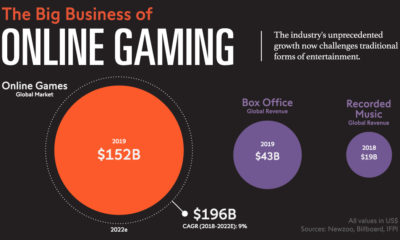
The Top TV Advertising Spenders in 2023
In 2023, advertising spend is projected to reach $61.3 billion on U.S. broadcast and cable TV.
Despite declining viewership, traditional TV has been found to be an optimal platform for storytelling ads. Additionally, advertisers can target viewer segments on traditional TV—similar to digital marketing channels.
The above graphic shows the top advertisers on traditional TV outlets, based on data from Nielsen.
Top 10 National TV Advertising Spenders
Here are the top advertisers on national U.S. broadcast and cable TV for the month of June 2023:
| Rank | Parent Company | Industry | Ad Spending June 2023 | Impressions |
|---|---|---|---|---|
| 1 | Procter & Gamble | Consumer Packaged Goods | $109.3M | 27.1B |
| 2 | Abbvie | Pharmaceuticals | $81.4M | 7.6B |
| 3 | GSK | Pharmaceuticals | $52.8M | 10.0B |
| 4 | Walt Disney | Media / Entertainment | $47.0M | 5.7B |
| 5 | Novo Nordisk | Pharmaceuticals | $44.4M | 4.9B |
| 6 | Progressive | Insurance | $38.5M | 4.9B |
| 7 | Alphabet | Technology | $38.0M | 2.5B |
| 8 | Warner Bros. Discovery | Media / Entertainment | $34.1M | 5.1B |
| 9 | Pepsico | Consumer Packaged Goods | $33.7M | 6.8B |
| 10 | Amazon | Technology / Retail / Media | $31.9M | 4.9B |
Procter & Gamble was the top TV advertising spender in the U.S., at $109.3 million. Home to Gillette, Crest, and Tide, the company spent a stunning $5.1 billion in overall advertising in 2022.
Pharmaceutical companies Abbvie and GSK were the next biggest spenders, at $81.4 million and $52.8 million, respectively. Overall, pharmaceuticals accounted for the largest share of advertising across the top 10.
Big tech companies Alphabet and Amazon also made the list, each spending over $30 million in June alone.
Top 10 Local TV Advertising Spenders
By contrast, the automotive sector made up seven of the top 10 local broadcast and cable TV advertisers, led by General Motors and Toyota:
| Rank | Parent Company | Industry | Ad Spending June 2023 | Impressions |
|---|---|---|---|---|
| 1 | General Motors | Automotive | $41.6M | 3.3B |
| 2 | Toyota | Automotive | $24.9M | 2.3B |
| 3 | Comcast | Communications | $20.6M | 1.5B |
| 4 | Hyundai | Automotive | $19.9M | 1.5B |
| 5 | Ford Motor | Automotive | $16.7M | 1.6B |
| 6 | Charter | Communications | $15.3M | 0.9B |
| 7 | Morgan & Morgan | Legal Services | $12.6M | 1.7B |
| 8 | Nissan | Automotive | $12.5M | 1.1B |
| 9 | Honda | Automotive | $12.3M | 1.0B |
| 10 | Volkswagen | Automotive | $10.8M | 1.2B |
Meanwhile, communication giants Comcast and Charter were big spenders, and the nation’s largest personal injury law firm, Morgan & Morgan, ranked in seventh overall.
U.S. Television Trends
Today, live TV viewership in the U.S. is primarily made up of those aged 65 and over, which spend nearly five hours per day watching TV. In contrast, those aged 25-34 spend only about one hour and 12 minutes per day watching live TV.
Furthermore, in 2022, fewer than half of U.S. viewers paid for traditional TV services for the first time. By year-end 2027, this proportion is projected to fall to just over a third of households.
Yet due to its scale of available media inventory, traditional TV may continue to bring in the bulk of TV advertising spending over the near future. One reason is that advertising makes up 20% of time spent on traditional TV but just 3% on streaming platforms.
However, as viewership declines, advertisers on live TV say that they are most likely to allocate their ad spend to streaming services. By year-end 2027, ad spend on streaming platforms is projected to jump to $40.9 billion, a 63% increase from 2023.


Markets
Mapped: Europe’s GDP Per Capita, by Country
Which European economies are richest on a GDP per capita basis? This map shows the results for 44 countries across the continent.


Mapped: Europe’s GDP Per Capita, by Country (2024)
This was originally posted on our Voronoi app. Download the app for free on iOS or Android and discover incredible data-driven charts from a variety of trusted sources.
Europe is home to some of the largest and most sophisticated economies in the world. But how do countries in the region compare with each other on a per capita productivity basis?
In this map, we show Europe’s GDP per capita levels across 44 nations in current U.S. dollars. Data for this visualization and article is sourced from the International Monetary Fund (IMF) via their DataMapper tool, updated April 2024.
Europe’s Richest and Poorest Nations, By GDP Per Capita
Luxembourg, Ireland, and Switzerland, lead the list of Europe’s richest nations by GDP per capita, all above $100,000.
| Rank | Country | GDP Per Capita (2024) |
|---|---|---|
| 1 | 🇱🇺 Luxembourg | $131,380 |
| 2 | 🇮🇪 Ireland | $106,060 |
| 3 | 🇨🇭 Switzerland | $105,670 |
| 4 | 🇳🇴 Norway | $94,660 |
| 5 | 🇮🇸 Iceland | $84,590 |
| 6 | 🇩🇰 Denmark | $68,900 |
| 7 | 🇳🇱 Netherlands | $63,750 |
| 8 | 🇸🇲 San Marino | $59,410 |
| 9 | 🇦🇹 Austria | $59,230 |
| 10 | 🇸🇪 Sweden | $58,530 |
| 11 | 🇧🇪 Belgium | $55,540 |
| 12 | 🇫🇮 Finland | $55,130 |
| 13 | 🇩🇪 Germany | $54,290 |
| 14 | 🇬🇧 UK | $51,070 |
| 15 | 🇫🇷 France | $47,360 |
| 16 | 🇦🇩 Andorra | $44,900 |
| 17 | 🇲🇹 Malta | $41,740 |
| 18 | 🇮🇹 Italy | $39,580 |
| 19 | 🇨🇾 Cyprus | $37,150 |
| 20 | 🇪🇸 Spain | $34,050 |
| 21 | 🇸🇮 Slovenia | $34,030 |
| 22 | 🇪🇪 Estonia | $31,850 |
| 23 | 🇨🇿 Czech Republic | $29,800 |
| 24 | 🇵🇹 Portugal | $28,970 |
| 25 | 🇱🇹 Lithuania | $28,410 |
| 26 | 🇸🇰 Slovakia | $25,930 |
| 27 | 🇱🇻 Latvia | $24,190 |
| 28 | 🇬🇷 Greece | $23,970 |
| 29 | 🇭🇺 Hungary | $23,320 |
| 30 | 🇵🇱 Poland | $23,010 |
| 31 | 🇭🇷 Croatia | $22,970 |
| 32 | 🇷🇴 Romania | $19,530 |
| 33 | 🇧🇬 Bulgaria | $16,940 |
| 34 | 🇷🇺 Russia | $14,390 |
| 35 | 🇹🇷 Türkiye | $12,760 |
| 36 | 🇲🇪 Montenegro | $12,650 |
| 37 | 🇷🇸 Serbia | $12,380 |
| 38 | 🇦🇱 Albania | $8,920 |
| 39 | 🇧🇦 Bosnia & Herzegovina | $8,420 |
| 40 | 🇲🇰 North Macedonia | $7,690 |
| 41 | 🇧🇾 Belarus | $7,560 |
| 42 | 🇲🇩 Moldova | $7,490 |
| 43 | 🇽🇰 Kosovo | $6,390 |
| 44 | 🇺🇦 Ukraine | $5,660 |
| N/A | 🇪🇺 EU Average | $44,200 |
Note: Figures are rounded.
Three Nordic countries (Norway, Iceland, Denmark) also place highly, between $70,000-90,000. Other Nordic peers, Sweden and Finland rank just outside the top 10, between $55,000-60,000.
Meanwhile, Europe’s biggest economies in absolute terms, Germany, UK, and France, rank closer to the middle of the top 20, with GDP per capitas around $50,000.
Finally, at the end of the scale, Eastern Europe as a whole tends to have much lower per capita GDPs. In that group, Ukraine ranks last, at $5,660.
A Closer Look at Ukraine
For a broader comparison, Ukraine’s per capita GDP is similar to Iran ($5,310), El Salvador ($5,540), and Guatemala ($5,680).
According to experts, Ukraine’s economy has historically underperformed to expectations. After the fall of the Berlin Wall, the economy contracted for five straight years. Its transition to a Western, liberalized economic structure was overshadowed by widespread corruption, a limited taxpool, and few revenue sources.
Politically, its transformation from authoritarian regime to civil democracy has proved difficult, especially when it comes to institution building.
Finally, after the 2022 invasion of the country, Ukraine’s GDP contracted by 30% in a single year—the largest loss since independence. Large scale emigration—to the tune of six million refugees—is also playing a role.
Despite these challenges, the country’s economic growth has somewhat stabilized while fighting continues.

-

 Wealth6 days ago
Charted: What Frustrates Americans About the Tax System
-

 Mining2 weeks ago
Visualizing Global Gold Production in 2023
-

 Markets2 weeks ago
Visualized: Interest Rate Forecasts for Advanced Economies
-

 Economy2 weeks ago
The Most Valuable Companies in Major EU Economies
-

 Markets2 weeks ago
The World’s Fastest Growing Emerging Markets (2024-2029 Forecast)
-

 Markets1 week ago
Visualizing Global Inflation Forecasts (2024-2026)
-

 Misc1 week ago
Charted: What Southeast Asia Thinks About China & the U.S.
-

 Misc1 week ago
The Evolution of U.S. Beer Logos