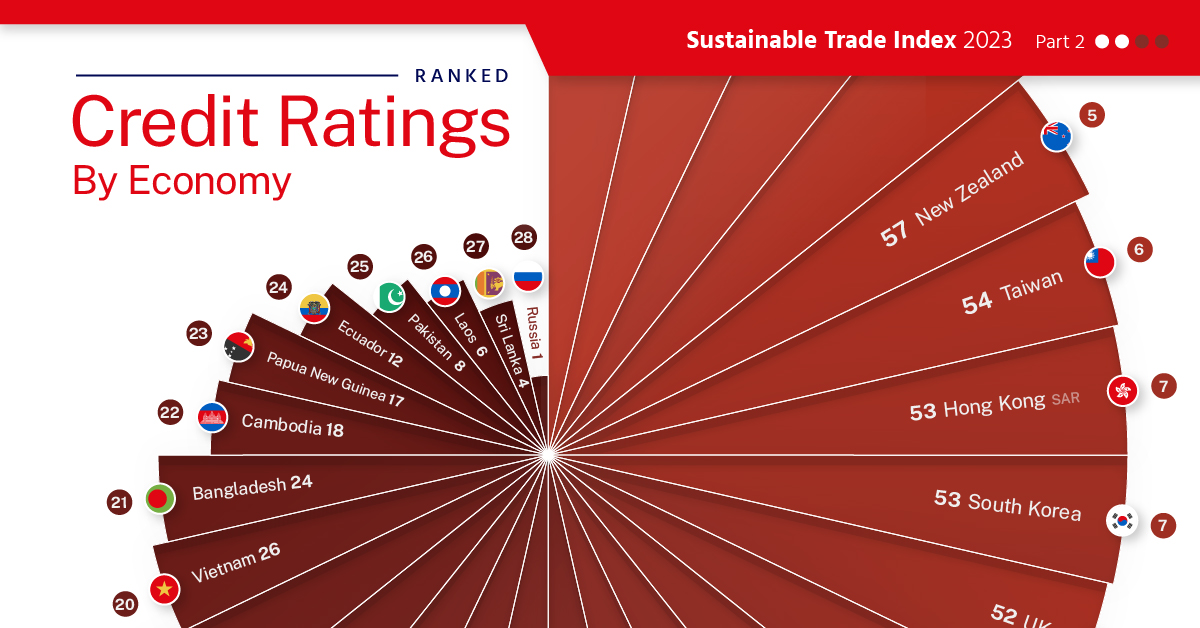
Ranking the Credit Ratings of Major Economies


Ranking the Credit Ratings of Major Economies
Country credit ratings assess the likelihood that a country will default on its debts, and are determined by international rating agencies like Standard & Poor’s (S&P), Moody’s, and Fitch Ratings.
Generally speaking, a higher rating results in lower borrowing costs for the country, while lower ratings can increase costs or even limit access to capital.
This graphic from The Hinrich Foundation shows the credit worthiness of 28 major economies, using an index of ratings from the three agencies mentioned above (S&P, Moody’s, Fitch).
The analysis comes from the 2023 Sustainable Trade Index (STI), which the Hinrich Foundation produced in collaboration with the IMD World Competitiveness Center.
Data Overview
To produce the STI’s credit rating metric, ratings from S&P, Moody’s, and Fitch were converted to a numerical score and averaged for each economy, with a range of 0-60 (60 being the highest). All data are as of 2022.
| Rank | Economy | Index Value |
|---|---|---|
| 1 | 🇦🇺 Australia | 60 |
| 1 | 🇸🇬 Singapore | 60 |
| 3 | 🇨🇦 Canada | 59 |
| 3 | 🇺🇸 United States | 59 |
| 5 | 🇳🇿 New Zealand | 57 |
| 6 | 🇹🇼 Taiwan | 54 |
| 7 | 🇭🇰 Hong Kong | 53 |
| 7 | 🇰🇷 South Korea | 53 |
| 9 | 🇬🇧 United Kingdom | 52 |
| 10 | 🇨🇳 China | 48 |
| 11 | 🇯🇵 Japan | 47 |
| 12 | 🇨🇱 Chile | 45 |
| 13 | 🇲🇾 Malaysia | 41 |
| 14 | 🇵🇪 Peru | 39 |
| 14 | 🇹🇭 Thailand | 39 |
| 16 | 🇵🇭 Philippines | 37 |
| 17 | 🇮🇩 Indonesia | 36 |
| 17 | 🇲🇽 Mexico | 36 |
| 19 | 🇮🇳 India | 33 |
| 20 | 🇻🇳 Vietnam | 26 |
| 21 | 🇧🇩 Bangladesh | 24 |
| 22 | 🇰🇭 Cambodia | 18 |
| 23 | 🇵🇬 Papua New Guinea | 17 |
| 24 | 🇪🇨 Ecuador | 12 |
| 25 | 🇵🇰 Pakistan | 8 |
| 26 | 🇱🇦 Laos | 6 |
| 27 | 🇱🇰 Sri Lanka | 4 |
| 28 | 🇷🇺 Russia | 1 |
Countries with advanced economies and stable political structures typically receive the highest credit ratings, but this is always subject to change. For example, in August 2023, Fitch Ratings announced it had downgraded the U.S. to an AA+ from AAA (the highest possible).
From Fitch’s press release:
The rating downgrade of the U.S. reflects the expected fiscal deterioration over the next three years, a high and growing general government debt burden, and the erosion of governance relative to ‘AA’ and ‘AAA’ rated peers over the last two decades that has manifested in repeated debt limit standoffs and last-minute resolutions.
Speaking of downgrades, one country that has received numerous in recent years is Russia, due to sanctions it faces as a result of the prolonged invasion of Ukraine. For example, S&P reduced Russia’s sovereign credit rating to a CCC-, which implies a default is imminent in the near future.
Explore the Sustainable Trade Index
This infographic was just a preview of what the Sustainable Trade Index has to offer. To learn more, visit The Hinrich Foundation, where you can download additional resources including the entire report for free.

-

 Markets2 days ago
Top 10 Countries Most in Debt to the IMF
Argentina tops the ranking, with a debt equivalent to 5.3% of the country’s GDP.
-
 Money2 days ago
Visualizing America’s Average Retirement Savings, by Age
How much have Americans actually saved for retirement? We show average retirement savings by age amid a widening savings gap.
-

 Personal Finance1 week ago
Visualizing the Tax Burden of Every U.S. State
Tax burden measures the percent of an individual’s income that is paid towards taxes. See where it’s the highest by state in this graphic.
-

 Money1 week ago
Charted: What Frustrates Americans About the Tax System
A survey during peak tax filing season reveals two big complaints that Americans have with the federal tax system.
-

 Money2 weeks ago
Ranked: The Top 20 Countries in Debt to China
The 20 nations featured in this graphic each owe billions in debt to China, posing concerns for their economic future.
-

 Wealth3 weeks ago
Charted: Which Country Has the Most Billionaires in 2024?
According to the annual Hurun Global Rich List, the U.S. and China are home to nearly half of the world’s 3,279 billionaires in 2024.