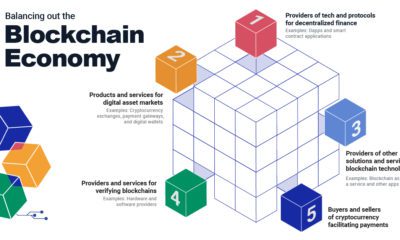

The blockchain economy enables trustless financial systems, with billions of dollars engaged in decentralized finance applications.
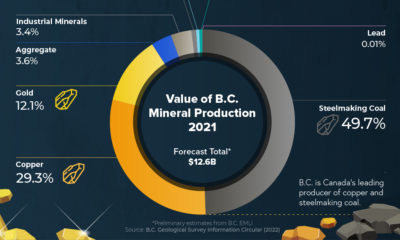

Here are 9 reasons to invest in British Columbia's mining and exploration industry.
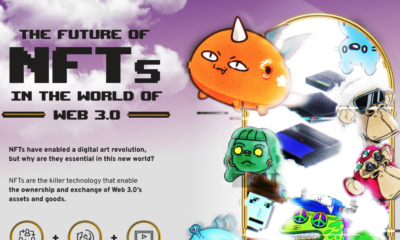

NFTs are revolutionizing digital asset ownership and laying the foundations for play-to-earn games, the metaverse economy, and more.
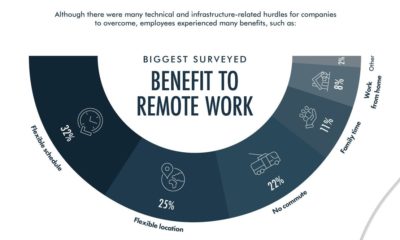

Since the COVID 19 pandemic, remote work has gone under a paradigm shift. This graphic breaks down the new world of work and for investors.


The history of shaving dates back to ancient times. This graphic explores its timeline and takes a look at the modern shaving landscape.
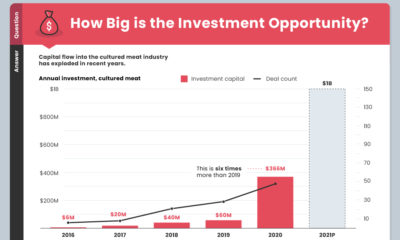

By 2030, the cultured meat market could be worth $25 billion. Before you invest, here are the answers to your burning questions.
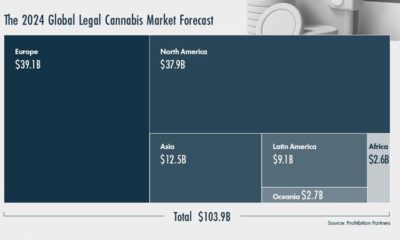

The cannabis industry has made monumental strides but is still in its infancy. Check out why cannabis can be worth billions more by 2024.
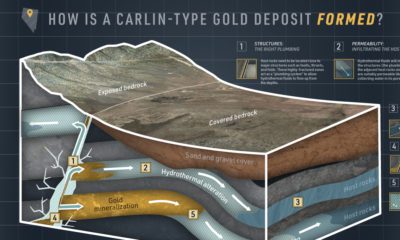

Explore everything about Carlin-type gold deposits in this infographic.


The modern day cannabis consumer is transforming. What do these trends mean for cannabis and the consumer discretionary sector?
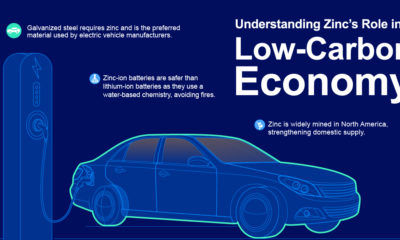

Many people are unaware of zinc’s powerful applications. This graphic by Teck looks at zinc's important role in the low-carbon economy.


