Top 10 Countries Most in Debt to the IMF
Ranked: The Top 6 Economies by Share of Global GDP (1980-2024)
Mapped: Europe’s GDP Per Capita, by Country
The Growth of a $1,000 Equity Investment, by Stock Market
Mapped: The Most Valuable Company in Each Southeast Asian Country
Countries With the Highest Rates of Crypto Ownership
Mapped: The Number of AI Startups By Country
All of the Grants Given by the U.S. CHIPS Act
Visualizing AI Patents by Country
How Tech Logos Have Evolved Over Time
Visualizing America’s Average Retirement Savings, by Age
Visualizing the Tax Burden of Every U.S. State
Charted: What Frustrates Americans About the Tax System
Ranked: The Top 20 Countries in Debt to China
Mapped: Countries Where Recreational Cannabis is Legal
Which Countries Have the Highest Infant Mortality Rates?
Life Expectancy by Region (1950-2050F)
What Causes Preventable Child Deaths?
The Cost of an EpiPen in Major Markets
Who’s Building the Most Solar Energy?
Mapped: The Age of Energy Projects in Interconnection Queues, by State
Ranked: The Top 10 EV Battery Manufacturers in 2023
The World’s Biggest Nuclear Energy Producers
The World’s Biggest Oil Producers in 2023
Mapped: U.S. States By Number of Cities Over 250,000 Residents
Mapped: U.S. Immigrants by Region
Mapped: Southeast Asia’s GDP Per Capita, by Country
The Largest Earthquakes in the New York Area (1970-2024)
The Biggest Salt Producing Countries in 2023
Visualizing Copper Production by Country in 2023
Where the World’s Aluminum is Smelted, by Country
Visualizing Global Gold Production in 2023
How People Get Around in America, Europe, and Asia
The Carbon Footprint of Major Travel Methods
Ranking the Top 15 Countries by Carbon Tax Revenue
Ranked: The Countries With the Most Air Pollution in 2023
Top Countries By Forest Growth Since 2001
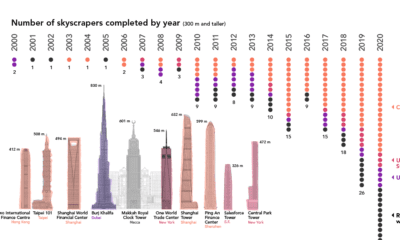
Once a rarity, supertall skyscrapers now punctuate the skylines of cities around the world. We chart the construction of these structures over the past 20 years
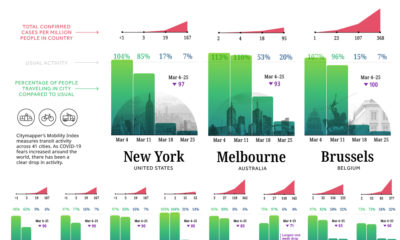
Amid the COVID-19 crisis, cities are dramatically slowing down. Today's chart demonstrates the impact of lockdowns on commuter activity worldwide.
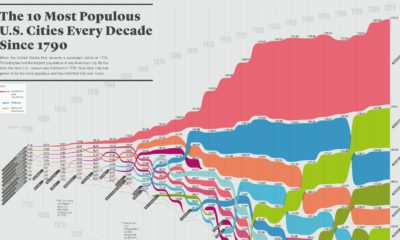
How has the list of the most populous U.S. cities changed over time? This infographic shows the top 10 cities of every decade since the year...
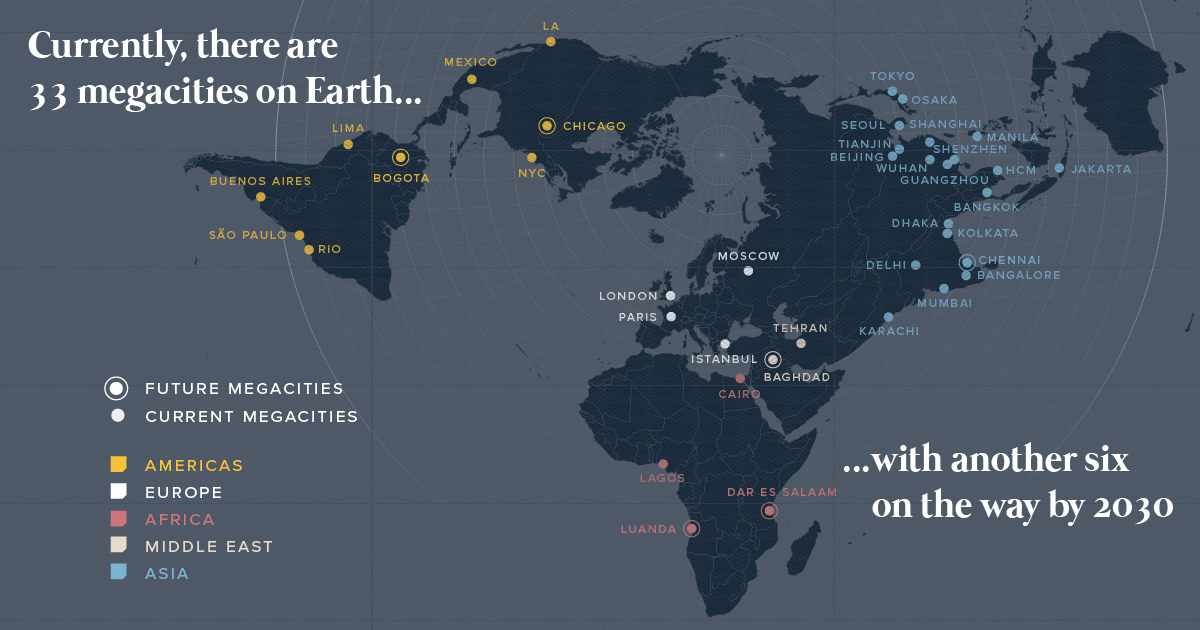
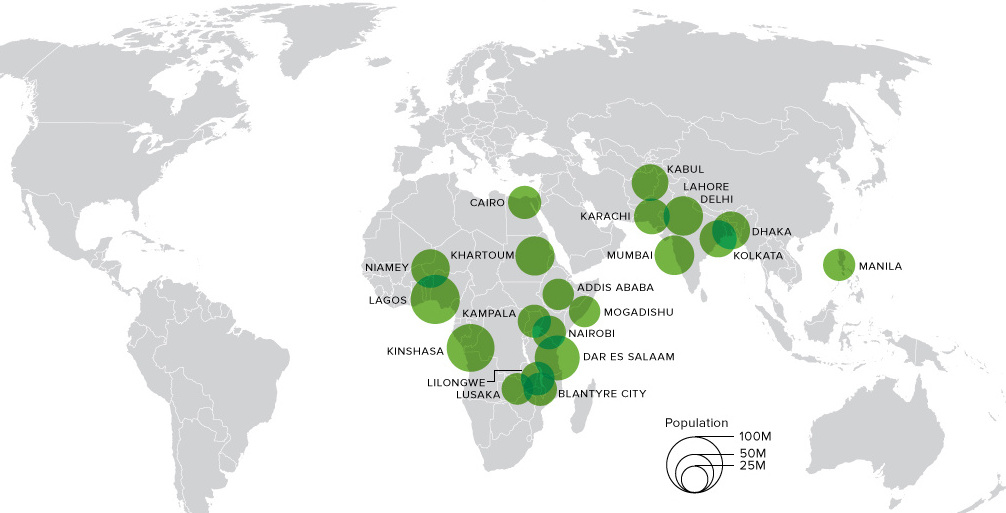
There are currently 33 megacities in the world with over 10 million inhabitants - but by 2030, there will be six new megacities, including one in...
This animation shows big changes in the world's most populous cities over the next 80+ years. Africa alone will hold 13 cities bigger than NYC by...
In this visualization, we rank the top 50 websites that receive the most internet traffic, from Google to CNN.
New VC+ subscribers get access to a special gift: a roundup of our best ever visualizations around population.
Higher education is facing a new wave of change during the pandemic. What are the new priorities of 2,200 students and staff worldwide?
Nearly 6,000 satellites circle our tiny planet. About 60% are space junk, 40% are operational—and hundreds more are launched every year.
This motion graphic video details a vision of what the mining company of the future could look like.