Mapped: The 10 U.S. States With the Lowest Real GDP Growth
Ranked: The World’s 50 Largest Private Equity Firms
Top 10 Countries Most in Debt to the IMF
Ranked: The Top 6 Economies by Share of Global GDP (1980-2024)
Mapped: Europe’s GDP Per Capita, by Country
Countries With the Highest Rates of Crypto Ownership
Mapped: The Number of AI Startups By Country
All of the Grants Given by the U.S. CHIPS Act
Visualizing AI Patents by Country
How Tech Logos Have Evolved Over Time
Visualizing America’s Average Retirement Savings, by Age
Visualizing the Tax Burden of Every U.S. State
Charted: What Frustrates Americans About the Tax System
Ranked: The Top 20 Countries in Debt to China
Mapped: Countries Where Recreational Cannabis is Legal
Which Countries Have the Highest Infant Mortality Rates?
Life Expectancy by Region (1950-2050F)
What Causes Preventable Child Deaths?
The Cost of an EpiPen in Major Markets
Who’s Building the Most Solar Energy?
Mapped: The Age of Energy Projects in Interconnection Queues, by State
Ranked: The Top 10 EV Battery Manufacturers in 2023
The World’s Biggest Nuclear Energy Producers
The World’s Biggest Oil Producers in 2023
Mapped: The Top Exports in Asian Countries
Mapped: U.S. States By Number of Cities Over 250,000 Residents
Mapped: U.S. Immigrants by Region
The Biggest Salt Producing Countries in 2023
Visualizing Copper Production by Country in 2023
Where the World’s Aluminum is Smelted, by Country
Visualizing Global Gold Production in 2023
How People Get Around in America, Europe, and Asia
The Carbon Footprint of Major Travel Methods
Ranking the Top 15 Countries by Carbon Tax Revenue
Ranked: The Countries With the Most Air Pollution in 2023
Top Countries By Forest Growth Since 2001
In this eighth edition of our yearly round-up, we highlight visualizations that broke new ground in design and data-driven reporting.
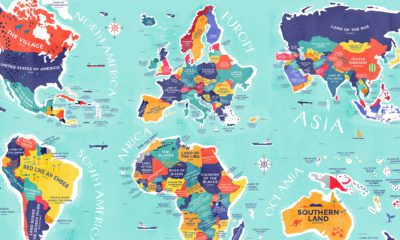
From Colombia to China, explore this map to uncover the diverse histories and cultures represented in the literal translation of each country's name.
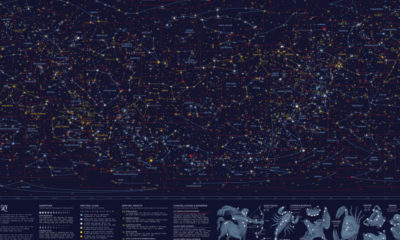
This striking map depicts all the stars and celestial bodies that are visible in the night sky, all on one giant backdrop.
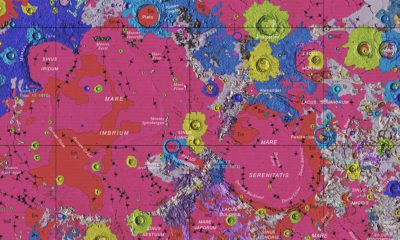
Behold the glory of the Unified Geologic Map of the Moon, which brings decades of data into one map, revealing the potential for exploration.
In a rapidly changing economy, some skill sets are losing their sheen. Here are the worst college majors for finding a job.
The median student debt for a U.S. bachelor's degree ranges from $43,000 to $13,000. View this graphic to see where each major falls in line.
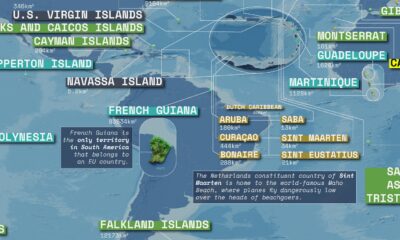
This massive map highlights overseas territories and dependencies around the world and their sovereign states.
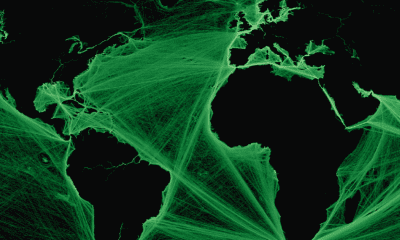
Where are the world’s major shipping lanes? These maps show global maritime traffic density, highlighting some of the busiest areas across the globe.
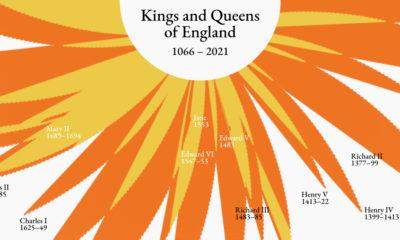
Who sat on the throne and for how long? This visualization highlights the reigns of England’s kings and queens from 1066 to present day.
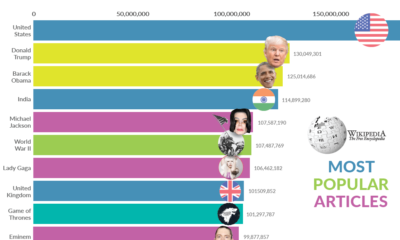
Millions flock to Wikipedia every day to satisfy their curiosity on every imaginable topic. What have been the most popular Wikipedia pages over time?


 Creator Program