Misc
Visualizing 1,000 Years of England’s Kings and Queens
Article/Editing:
Here’s the interactive version of this graphic
Visualizing 1,000 Years of England’s Kings and Queens
As far back as the 9th century, when Athelstan, grandson of Alfred the Great, became King, England has had a ruling monarchy.
Many countries have had monarchies at some point in history, though few are still recognized today. However, England’s monarchy is very much present, with the most recent sovereign, Queen Elizabeth II, having reigned for over 70 years.
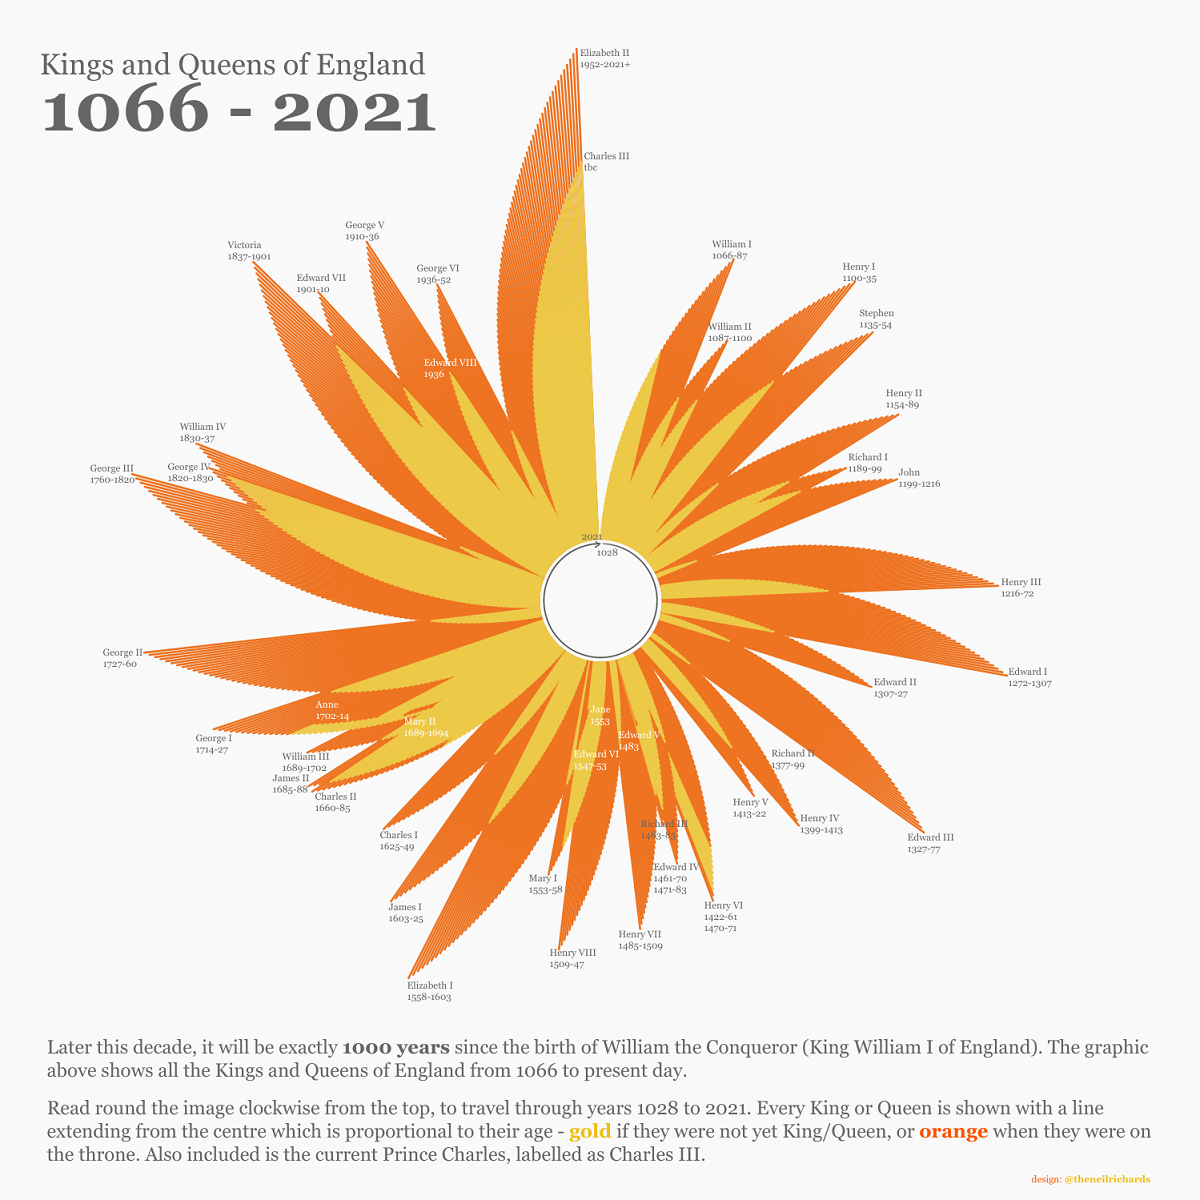
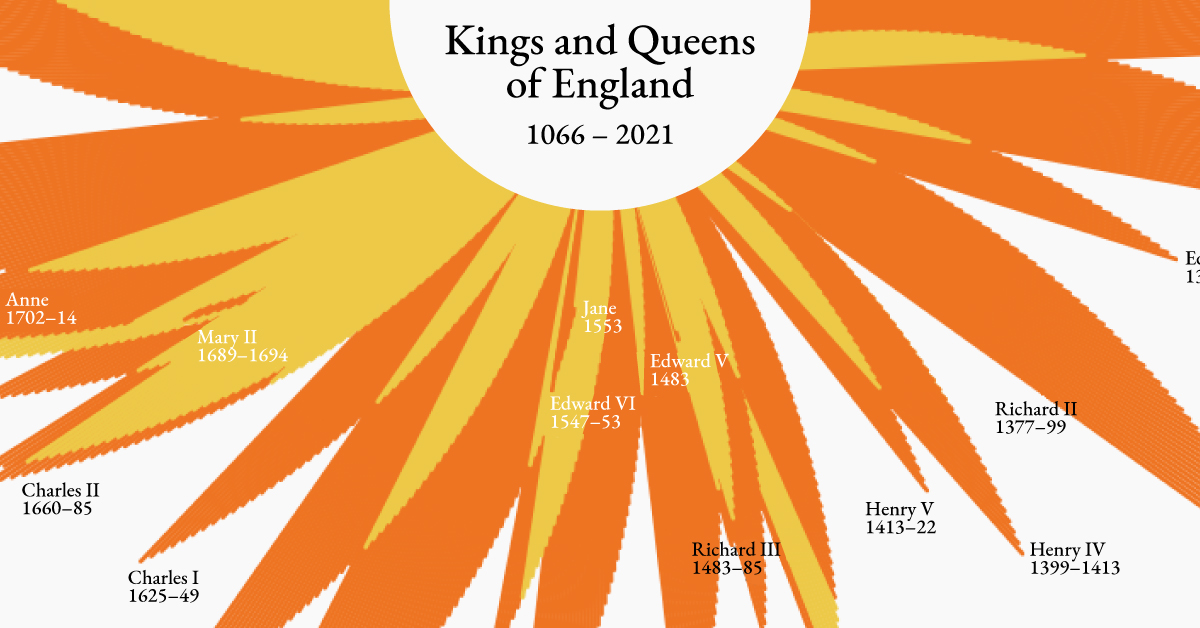
This visualization by Neil Richards illustrates the reigns of England’s kings and queens from 1066 to 2021.
England’s Kings and Queens (1066–2021)
The English monarchy is passed from generation to generation, from parent to eldest child, a tradition that started with the sovereign William I (also known as William the Conqueror).
Up until 1702, this order of succession only applied to male heirs, until Parliament passed the Act of Settlement which allowed women to inherit the throne if a male heir was unavailable. Not until 2013 were these rules further updated to allow a female to inherit the throne if she is the eldest child, regardless of male heirs.
| Monarch | Reign | Length of Reign (Years) |
|---|---|---|
| William I | 1066–1087 | 20 |
| William II | 1087–1100 | 12 |
| Henry I | 1100–1135 | 35 |
| Stephen | 1135–1154 | 18 |
| Henry II | 1154–1189 | 34 |
| Richard I | 1189–1199 | 09 |
| John | 1199–1216 | 17 |
| Henry III | 1216–1272 | 56 |
| Edward I | 1272–1307 | 34 |
| Edward II | 1307–1327 | 19 |
| Edward III | 1327–1377 | 50 |
| Richard II | 1377–1399 | 22 |
| Henry IV | 1399–1413 | 13 |
| Henry V | 1413–1422 | 09 |
| Henry VI | 1422–1461 | 38 |
| Edward IV | 1461–1470 | 09 |
| Henry VI | 1470–1471 | 0.5 (191 days) |
| Edward IV | 1471–1483 | 11 |
| Edward V | 1483 | 0.2 (78 days) |
| Richard III | 1483–1485 | 02 |
| Henry VII | 1485–1509 | 23 |
| Henry VIII | 1509–1547 | 37 |
| Edward VI | 1547–1553 | 06 |
| Jane | 1553 | 0.02 (9 days) |
| Mary I | 1553–1558 | 05 |
| Elizabeth I | 1558–1603 | 44 |
| James I | 1603–1625 | 22 |
| Charles I | 1625–1649 | 23 |
| Charles II | 1660–1685 | 24 |
| James II | 1685–1688 | 03 |
| Mary II | 1689–1694 | 05 |
| William III | 1689–1702 | 13 |
| Anne | 1702–1714 | 12 |
| George I | 1714–1727 | 12 |
| George II | 1727–1760 | 33 |
| George III | 1760–1820 | 59 |
| George IV | 1820–1830 | 10 |
| William IV | 1830–1837 | 06 |
| Victoria | 1837–1901 | 63 |
| Edward VII | 1901–1910 | 09 |
| George V | 1910–1936 | 25 |
| Edward VIII | 1936 | 0.9 (327 days) |
| George VI | 1936–1952 | 15 |
| Elizabeth II | 1952–Present | 70+ |
One notable time frame missing is 1650–1659, which had no reigning monarch following the beheading of Charles I in 1649. Instead, England was ruled by Parliament in a period known as the Commonwealth of England, which lasted until 1653. That year, a coup d’état led by Oliver Cromwell ensued, leading to the eventual restoration of the monarchy in 1660, reigned by Charles II.
Other reigns of interest include the shortest reigning monarch, Jane, who held the throne for just nine days in 1553. Previously, King Edward VI had overruled the order of succession in naming Jane his heir. This was disputed and Edward VI’s half-sister, Mary I, was then crowned.
The longest reigning monarch is Elizabeth II, who had been on the throne for over 70 years. Before her, the longest reign was held by Victoria, Elizabeth II’s great-great-grandmother, from 1837 to 1901 (63 years).
Why Does England’s Monarchy Still Exist?
Today, the English monarchy is largely symbolic. The monarch serves as the Head of State in a ceremonial position, while Parliament, a representative government body headed by the Prime Minister, holds all real political power.
Instead, the monarch’s main duty is to provide ceremonial speeches and formal appearances, specifically for the opening of each new Parliament and on holidays and other special occasions. Though the Prime Minister briefs the monarch regularly on national affairs, it is understood that they will never provide opinions on political matters nor make any final decisions.
This beginning of this shift in political power was first established in 1215 with the signing of the Magna Carta by King John. Essentially one of the first written constitutions, it recognized the King and all future sovereigns as being subject to the law, not above it.
The Future of the Monarchy
Currently next in line to the throne is the Queen’s eldest son Charles, Prince of Wales, followed by his eldest son William, Duke of Cambridge.
And though there is much criticism of England’s monarchy as an outdated, expensive and inegalitarian system, the majority of England’s citizens are still in favor of the institution.
Advocates for a reigning king or queen look at the monarch’s role in unifying the nation and providing reassurance in times of uncertainty. They see the royal family as a symbol for their country, bringing in massive revenues in tourism.
With 61% of polled British adults in 2021 believing that the monarchy should stay, it is safe to assume that the institution will continue in the near future. But as the world continues to shift around us, how will that attitude evolve over time?

This article was published as a part of Visual Capitalist's Creator Program, which features data-driven visuals from some of our favorite Creators around the world.


VC+
VC+: Get Our Key Takeaways From the IMF’s World Economic Outlook
A sneak preview of the exclusive VC+ Special Dispatch—your shortcut to understanding IMF’s World Economic Outlook report.

Have you read IMF’s latest World Economic Outlook yet? At a daunting 202 pages, we don’t blame you if it’s still on your to-do list.
But don’t worry, you don’t need to read the whole April release, because we’ve already done the hard work for you.
To save you time and effort, the Visual Capitalist team has compiled a visual analysis of everything you need to know from the report—and our upcoming VC+ Special Dispatch will be available exclusively to VC+ members on Thursday, April 25th.
If you’re not already subscribed to VC+, make sure you sign up now to receive the full analysis of the IMF report, and more (we release similar deep dives every week).
For now, here’s what VC+ members can expect to receive.
Your Shortcut to Understanding IMF’s World Economic Outlook
With long and short-term growth prospects declining for many countries around the world, this Special Dispatch offers a visual analysis of the key figures and takeaways from the IMF’s report including:
- The global decline in economic growth forecasts
- Real GDP growth and inflation forecasts for major nations in 2024
- When interest rate cuts will happen and interest rate forecasts
- How debt-to-GDP ratios have changed since 2000
- And much more!

Get the Full Breakdown in the Next VC+ Special Dispatch
VC+ members will receive the full Special Dispatch on Thursday, April 25th.
Make sure you join VC+ now to receive exclusive charts and the full analysis of key takeaways from IMF’s World Economic Outlook.
Don’t miss out. Become a VC+ member today.
What You Get When You Become a VC+ Member
VC+ is Visual Capitalist’s premium subscription. As a member, you’ll get the following:
- Special Dispatches: Deep dive visual briefings on crucial reports and global trends
- Markets This Month: A snappy summary of the state of the markets and what to look out for
- The Trendline: Weekly curation of the best visualizations from across the globe
- Global Forecast Series: Our flagship annual report that covers everything you need to know related to the economy, markets, geopolitics, and the latest tech trends
- VC+ Archive: Hundreds of previously released VC+ briefings and reports that you’ve been missing out on, all in one dedicated hub
You can get all of the above, and more, by joining VC+ today.

-

 Green1 week ago
Ranked: The Countries With the Most Air Pollution in 2023
-

 AI2 weeks ago
The Stock Performance of U.S. Chipmakers So Far in 2024
-

 Markets2 weeks ago
Charted: Big Four Market Share by S&P 500 Audits
-

 Real Estate2 weeks ago
Ranked: The Most Valuable Housing Markets in America
-

 Money2 weeks ago
Which States Have the Highest Minimum Wage in America?
-

 AI2 weeks ago
Ranked: Semiconductor Companies by Industry Revenue Share
-

 Travel2 weeks ago
Ranked: The World’s Top Flight Routes, by Revenue
-

 Countries2 weeks ago
Population Projections: The World’s 6 Largest Countries in 2075