Mapped: Europe’s GDP Per Capita, by Country
The Growth of a $1,000 Equity Investment, by Stock Market
Mapped: The Most Valuable Company in Each Southeast Asian Country
Visualizing Global Inflation Forecasts (2024-2026)
The World’s Fastest Growing Emerging Markets (2024-2029 Forecast)
Countries With the Highest Rates of Crypto Ownership
Mapped: The Number of AI Startups By Country
All of the Grants Given by the U.S. CHIPS Act
Visualizing AI Patents by Country
How Tech Logos Have Evolved Over Time
Charted: What Frustrates Americans About the Tax System
Ranked: The Top 20 Countries in Debt to China
Charted: Which Country Has the Most Billionaires in 2024?
Charted: Which City Has the Most Billionaires in 2024?
Charted: Who Has Savings in This Economy?
Life Expectancy by Region (1950-2050F)
What Causes Preventable Child Deaths?
The Cost of an EpiPen in Major Markets
Charted: Global Tobacco Use by Country and Sex
Visualized: What Lives in Your Gut Microbiome?
Who’s Building the Most Solar Energy?
Mapped: The Age of Energy Projects in Interconnection Queues, by State
Ranked: The Top 10 EV Battery Manufacturers in 2023
The World’s Biggest Nuclear Energy Producers
The World’s Biggest Oil Producers in 2023
The Largest Earthquakes in the New York Area (1970-2024)
Mapped: Average Wages Across Europe
Mapped: Asia’s Population Patterns by Density
A Map of Global Happiness By Country in 2024
Mapped: Population Growth by Region (1900-2050F)
Visualizing Global Gold Production in 2023
Gold vs. S&P 500: Which Has Grown More Over Five Years?
Charted: The Value Gap Between the Gold Price and Gold Miners
Charted: Global Uranium Reserves, by Country
The Carbon Footprint of Major Travel Methods
Ranking the Top 15 Countries by Carbon Tax Revenue
Ranked: The Countries With the Most Air Pollution in 2023
Top Countries By Forest Growth Since 2001
Ranked: Top Countries by Total Forest Loss Since 2001
Visual Capitalist is launching a new app that will combine powerful data and visual storytelling. Learn more about how to support it here.
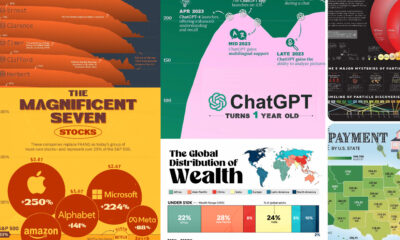
We round up the most popular, most discussed, and most liked visualizations of the month on Voronoi, our new data storytelling platform.
Get Visual Capitalist's new app, Voronoi, and discover the world's most interesting data and stories, all on one trusted platform.
See the most popular, most discussed, and most liked visualizations on our new data storytelling app Voronoi in December.
We're closing in on reaching our funding goal for the VC App, but still need your help. Just 2 days are left to hit the goal.
How have investment returns for different portfolio allocations of stocks and bonds compared over the last 90 years?
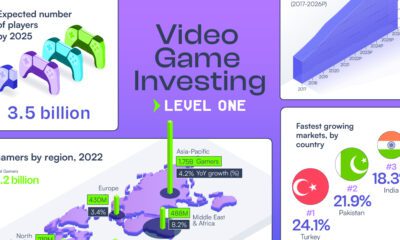
Video gaming is the most popular form of entertainment. But how people engage with video games looks different by generation.
With 3.2 billion global gamers and $227 billion projected revenue in 2023, the video games industry presents diverse investment chances.
This graphic looks at 29 different psychological tricks that marketers use to try and influence consumer behavior.
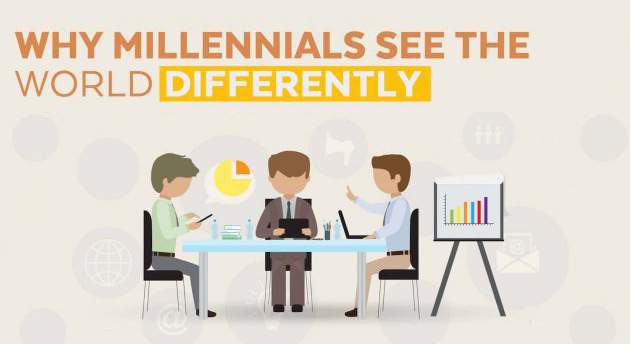
Millennials continue to puzzle the general population, but this infographic has 29 facts that may help you see millennials differently.