Top 10 Countries Most in Debt to the IMF
Ranked: The Top 6 Economies by Share of Global GDP (1980-2024)
Mapped: Europe’s GDP Per Capita, by Country
The Growth of a $1,000 Equity Investment, by Stock Market
Mapped: The Most Valuable Company in Each Southeast Asian Country
Countries With the Highest Rates of Crypto Ownership
Mapped: The Number of AI Startups By Country
All of the Grants Given by the U.S. CHIPS Act
Visualizing AI Patents by Country
How Tech Logos Have Evolved Over Time
Visualizing America’s Average Retirement Savings, by Age
Visualizing the Tax Burden of Every U.S. State
Charted: What Frustrates Americans About the Tax System
Ranked: The Top 20 Countries in Debt to China
Mapped: Countries Where Recreational Cannabis is Legal
Which Countries Have the Highest Infant Mortality Rates?
Life Expectancy by Region (1950-2050F)
What Causes Preventable Child Deaths?
The Cost of an EpiPen in Major Markets
Who’s Building the Most Solar Energy?
Mapped: The Age of Energy Projects in Interconnection Queues, by State
Ranked: The Top 10 EV Battery Manufacturers in 2023
The World’s Biggest Nuclear Energy Producers
The World’s Biggest Oil Producers in 2023
Mapped: U.S. States By Number of Cities Over 250,000 Residents
Mapped: U.S. Immigrants by Region
Mapped: Southeast Asia’s GDP Per Capita, by Country
The Largest Earthquakes in the New York Area (1970-2024)
The Biggest Salt Producing Countries in 2023
Visualizing Copper Production by Country in 2023
Where the World’s Aluminum is Smelted, by Country
Visualizing Global Gold Production in 2023
How People Get Around in America, Europe, and Asia
The Carbon Footprint of Major Travel Methods
Ranking the Top 15 Countries by Carbon Tax Revenue
Ranked: The Countries With the Most Air Pollution in 2023
Top Countries By Forest Growth Since 2001
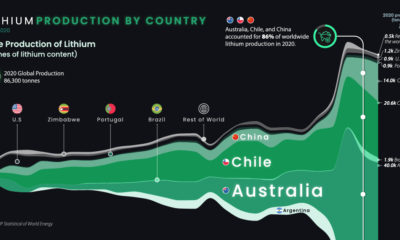
Global lithium production has more than doubled since 2016. This chart visualizes 25 years of lithium production by country.
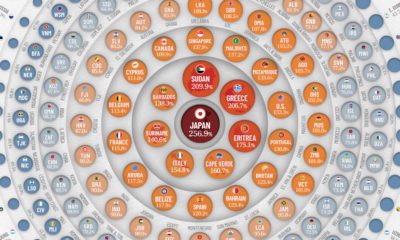
Global debt reached $226T by the end of 2020 – the biggest one-year jump since WWII. This graphic compares the debt-to-GDP ratio of various countries.
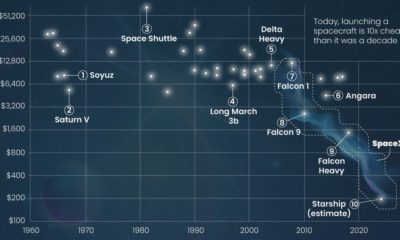
How much does a space flight cost? Here’s a look at the cost per kilogram for space launches across the globe since 1960.
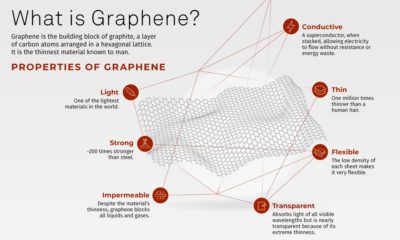
The market value for Graphene is going to be $2.8 billion in 2027. Here we introduce you to the material and its various applications.
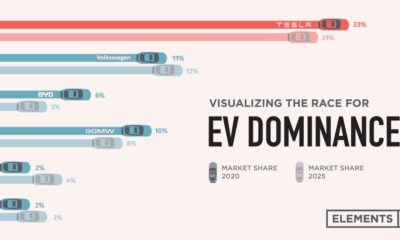
Tesla was the first automaker to hit a $1 trillion market cap, but other electric car companies have plans to unseat the dominant EV maker.
The spookiest time of the year is back. Here we visualize the most popular Halloween costumes in the U.S. in 2021.
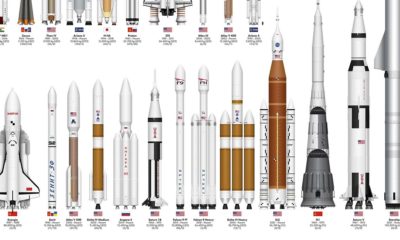
This infographic sizes up different rockets used to explore space, from the USSR's Soyuz to the SpaceX Starship.
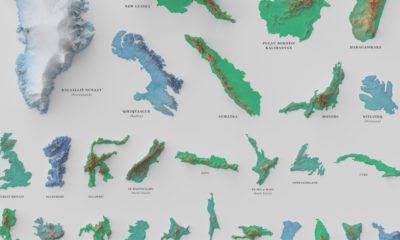
See the world's 100 biggest islands in a side-by-side comparison. Then, we look to see which islands have the highest population densities.
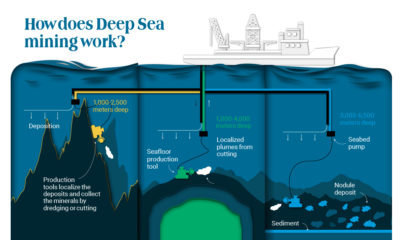
As more metals are necessary for electrification and clean energy transition, companies are looking at an unexplored market: ocean mining.
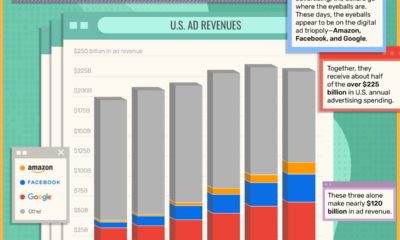
The U.S. ad space is dominated by the ad triopoly of Amazon, Facebook, and Google. Together, they make up over half of the $225 billion in...