Visualizing Berkshire Hathaway’s Stock Portfolio (Q1 2024)
Nvidia is Worth More Than All of These Companies Combined
Which Retailers Operate in the Most Countries?
Mapped: The 10 U.S. States With the Lowest Real GDP Growth
Ranked: The World’s 50 Largest Private Equity Firms
Ranked: The Top Startup Cities Around the World
Visualizing the 5 Most Common Cybersecurity Mistakes
Countries With the Highest Rates of Crypto Ownership
Mapped: The Number of AI Startups By Country
Mapped: The Income a Family Needs to Live Comfortably in Every U.S. State
Top 10 Countries Most in Debt to the IMF
Visualizing America’s Average Retirement Savings, by Age
Visualizing the Tax Burden of Every U.S. State
Charted: What Frustrates Americans About the Tax System
Visualizing Daily Protein Sources by Region
Mapped: Countries Where Recreational Cannabis is Legal
Which Countries Have the Highest Infant Mortality Rates?
Life Expectancy by Region (1950-2050F)
What Causes Preventable Child Deaths?
Ranked: The World’s Largest Lithium Producers in 2023
Who’s Building the Most Solar Energy?
Mapped: The Age of Energy Projects in Interconnection Queues, by State
Ranked: The Top 10 EV Battery Manufacturers in 2023
The World’s Biggest Nuclear Energy Producers
Map: Where Are America’s Largest Landfills?
Mapped: The World’s Wettest and Driest Countries
Mapped: Indian States with Cities Over 1 Million People
Mapped: The Top Export in Each EU Country
The Biggest Salt Producing Countries in 2023
Visualizing Copper Production by Country in 2023
Where the World’s Aluminum is Smelted, by Country
Visualizing Global Gold Production in 2023
How People Get Around in America, Europe, and Asia
The Carbon Footprint of Major Travel Methods
Ranking the Top 15 Countries by Carbon Tax Revenue
Ranked: The Countries With the Most Air Pollution in 2023
Top Countries By Forest Growth Since 2001
The U.S. labor market is remarkably strong, with a 3.4% unemployment rate. Which sectors are seeing the highest job gains in 2023?
See how 14 major automakers have adopted various fuel-saving technologies in this infographic based on EPA data.
How much oil, coal, and natural gas do we extract each year? See the scale of annual fossil fuel production in perspective.
Wealthy countries consume large amounts of natural resources per capita, and the U.S. is no exception. See how much is used per person.
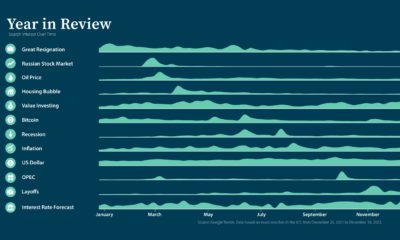
What was on investors' minds in 2022? Discover the top Google searches and how the dominant trends played out in portfolios.
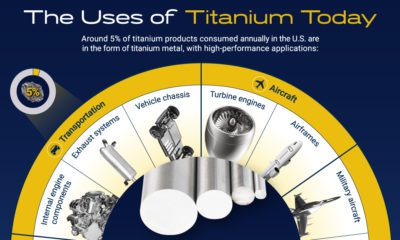
This infographic explores titanium's growth markets and potential for mainstream application.
Japanese automakers like Toyota are known to produce some of the longest lasting cars in the world, but does the data support this claim?
How has inflation impacted everyday goods like milk, flour, or fuel? This chart shows the annual change in the price of basic daily goods.
Who made it to the top? Here are the world's most valuable public companies in 2022 as the year comes to an end.
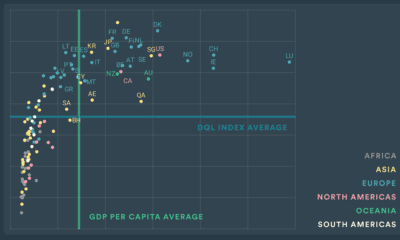
Which countries have the best internet quality, or electronic security? This index breaks down the digital quality of life of countries in 2022.


 Creator Program