Mapped: The 10 U.S. States With the Lowest Real GDP Growth
Ranked: The World’s 50 Largest Private Equity Firms
Top 10 Countries Most in Debt to the IMF
Ranked: The Top 6 Economies by Share of Global GDP (1980-2024)
Mapped: Europe’s GDP Per Capita, by Country
Countries With the Highest Rates of Crypto Ownership
Mapped: The Number of AI Startups By Country
All of the Grants Given by the U.S. CHIPS Act
Visualizing AI Patents by Country
How Tech Logos Have Evolved Over Time
Visualizing America’s Average Retirement Savings, by Age
Visualizing the Tax Burden of Every U.S. State
Charted: What Frustrates Americans About the Tax System
Ranked: The Top 20 Countries in Debt to China
Mapped: Countries Where Recreational Cannabis is Legal
Which Countries Have the Highest Infant Mortality Rates?
Life Expectancy by Region (1950-2050F)
What Causes Preventable Child Deaths?
The Cost of an EpiPen in Major Markets
Who’s Building the Most Solar Energy?
Mapped: The Age of Energy Projects in Interconnection Queues, by State
Ranked: The Top 10 EV Battery Manufacturers in 2023
The World’s Biggest Nuclear Energy Producers
The World’s Biggest Oil Producers in 2023
Mapped: The Top Exports in Asian Countries
Mapped: U.S. States By Number of Cities Over 250,000 Residents
Mapped: U.S. Immigrants by Region
The Biggest Salt Producing Countries in 2023
Visualizing Copper Production by Country in 2023
Where the World’s Aluminum is Smelted, by Country
Visualizing Global Gold Production in 2023
How People Get Around in America, Europe, and Asia
The Carbon Footprint of Major Travel Methods
Ranking the Top 15 Countries by Carbon Tax Revenue
Ranked: The Countries With the Most Air Pollution in 2023
Top Countries By Forest Growth Since 2001
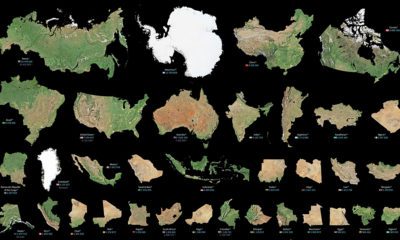
Maps can distort the size and shape of countries. This visualization puts the true size of land masses together from biggest to smallest.
Our planet is in a constant state of creation and destruction as the plates of the earth collide. This visualization looks at earthquake magnitude.
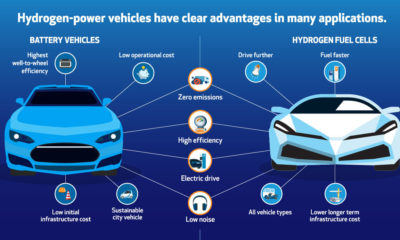
Here are six reasons why hydrogen and fuel cells can be a fit for helping with the transition to a lower-emission energy mix.
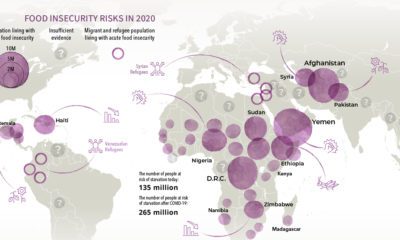
Over 135 million people face acute food insecurity worldwide—but COVID-19 could almost double these numbers. Which regions could be most affected?
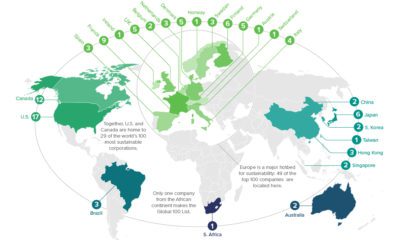
In the race towards a greener future, many corporations are playing an active role. Where are the world's most sustainable companies located?
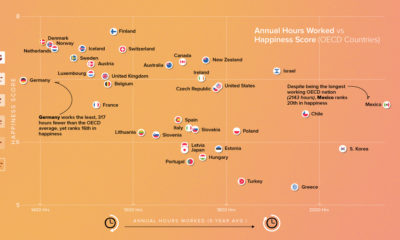
The idea of a shorter workweek sounds enticing to most, but would it actually lead to a happier population? We look at the data so far.
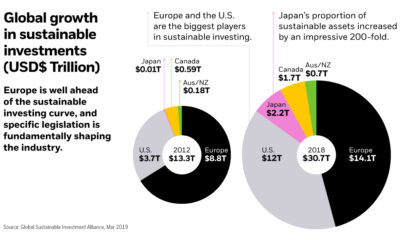
Total assets in sustainable investing reached nearly $31 trillion in 2018. What are the driving forces behind the global rise of sustainable investing?
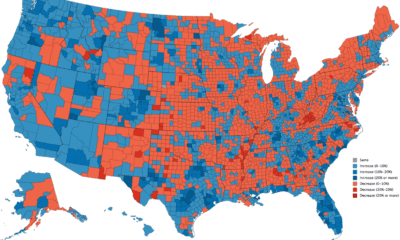
Rural counties across the U.S. are losing residents as large cities and the coasts are growing. This map shows U.S. population change by county.
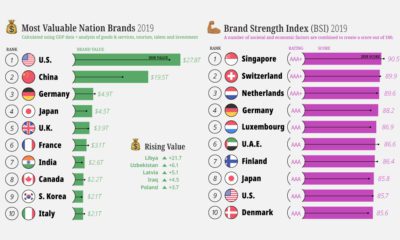
A country's national image can have a big impact on its economic fortunes. See which countries have the highest ranked nation brands.
After adjusting GDP for purchasing power parity (PPP), here is how the composition of the world economy breaks down by country.