Culture
How To Spot Fake News


How To Spot Fake News
“Fake news” used to be a relatively uncommon problem, but over the last decade, and especially during the COVID-19 pandemic, increasing consumption of news and articles has caused misinformation to run wild.
Far from a new concept, misinformation and cherry-picked stories have been used throughout history as a form of propaganda or information warfare. However, the rise of social media as a hub for sharing articles has spread “fake news”—false or misleading information presented as legitimate news—all over the internet.
Fueled further by increasing polarization, as well as the use of the term by former U.S. President Donald Trump to also refer to negative coverage (whether legitimate or misinformed), it seems more difficult than ever to separate trustworthy from misleading sources.
With this in mind, we combined guidance from non-profit journalism project First Draft News and the International Federation of Library Associations and Institutions (IFLA) to create this guide for understanding “fake news” and how to spot it.
The Different Types of “Fake News”
In order to spot fake news, you have to know the many forms misinformation can take.
Not all fake news is created equal, or even with the intent to deceive. Some start as opinions or jokes that become misunderstood, twisted over time, and eventually turn into misinformation. Others begin with the sole purpose of deception.
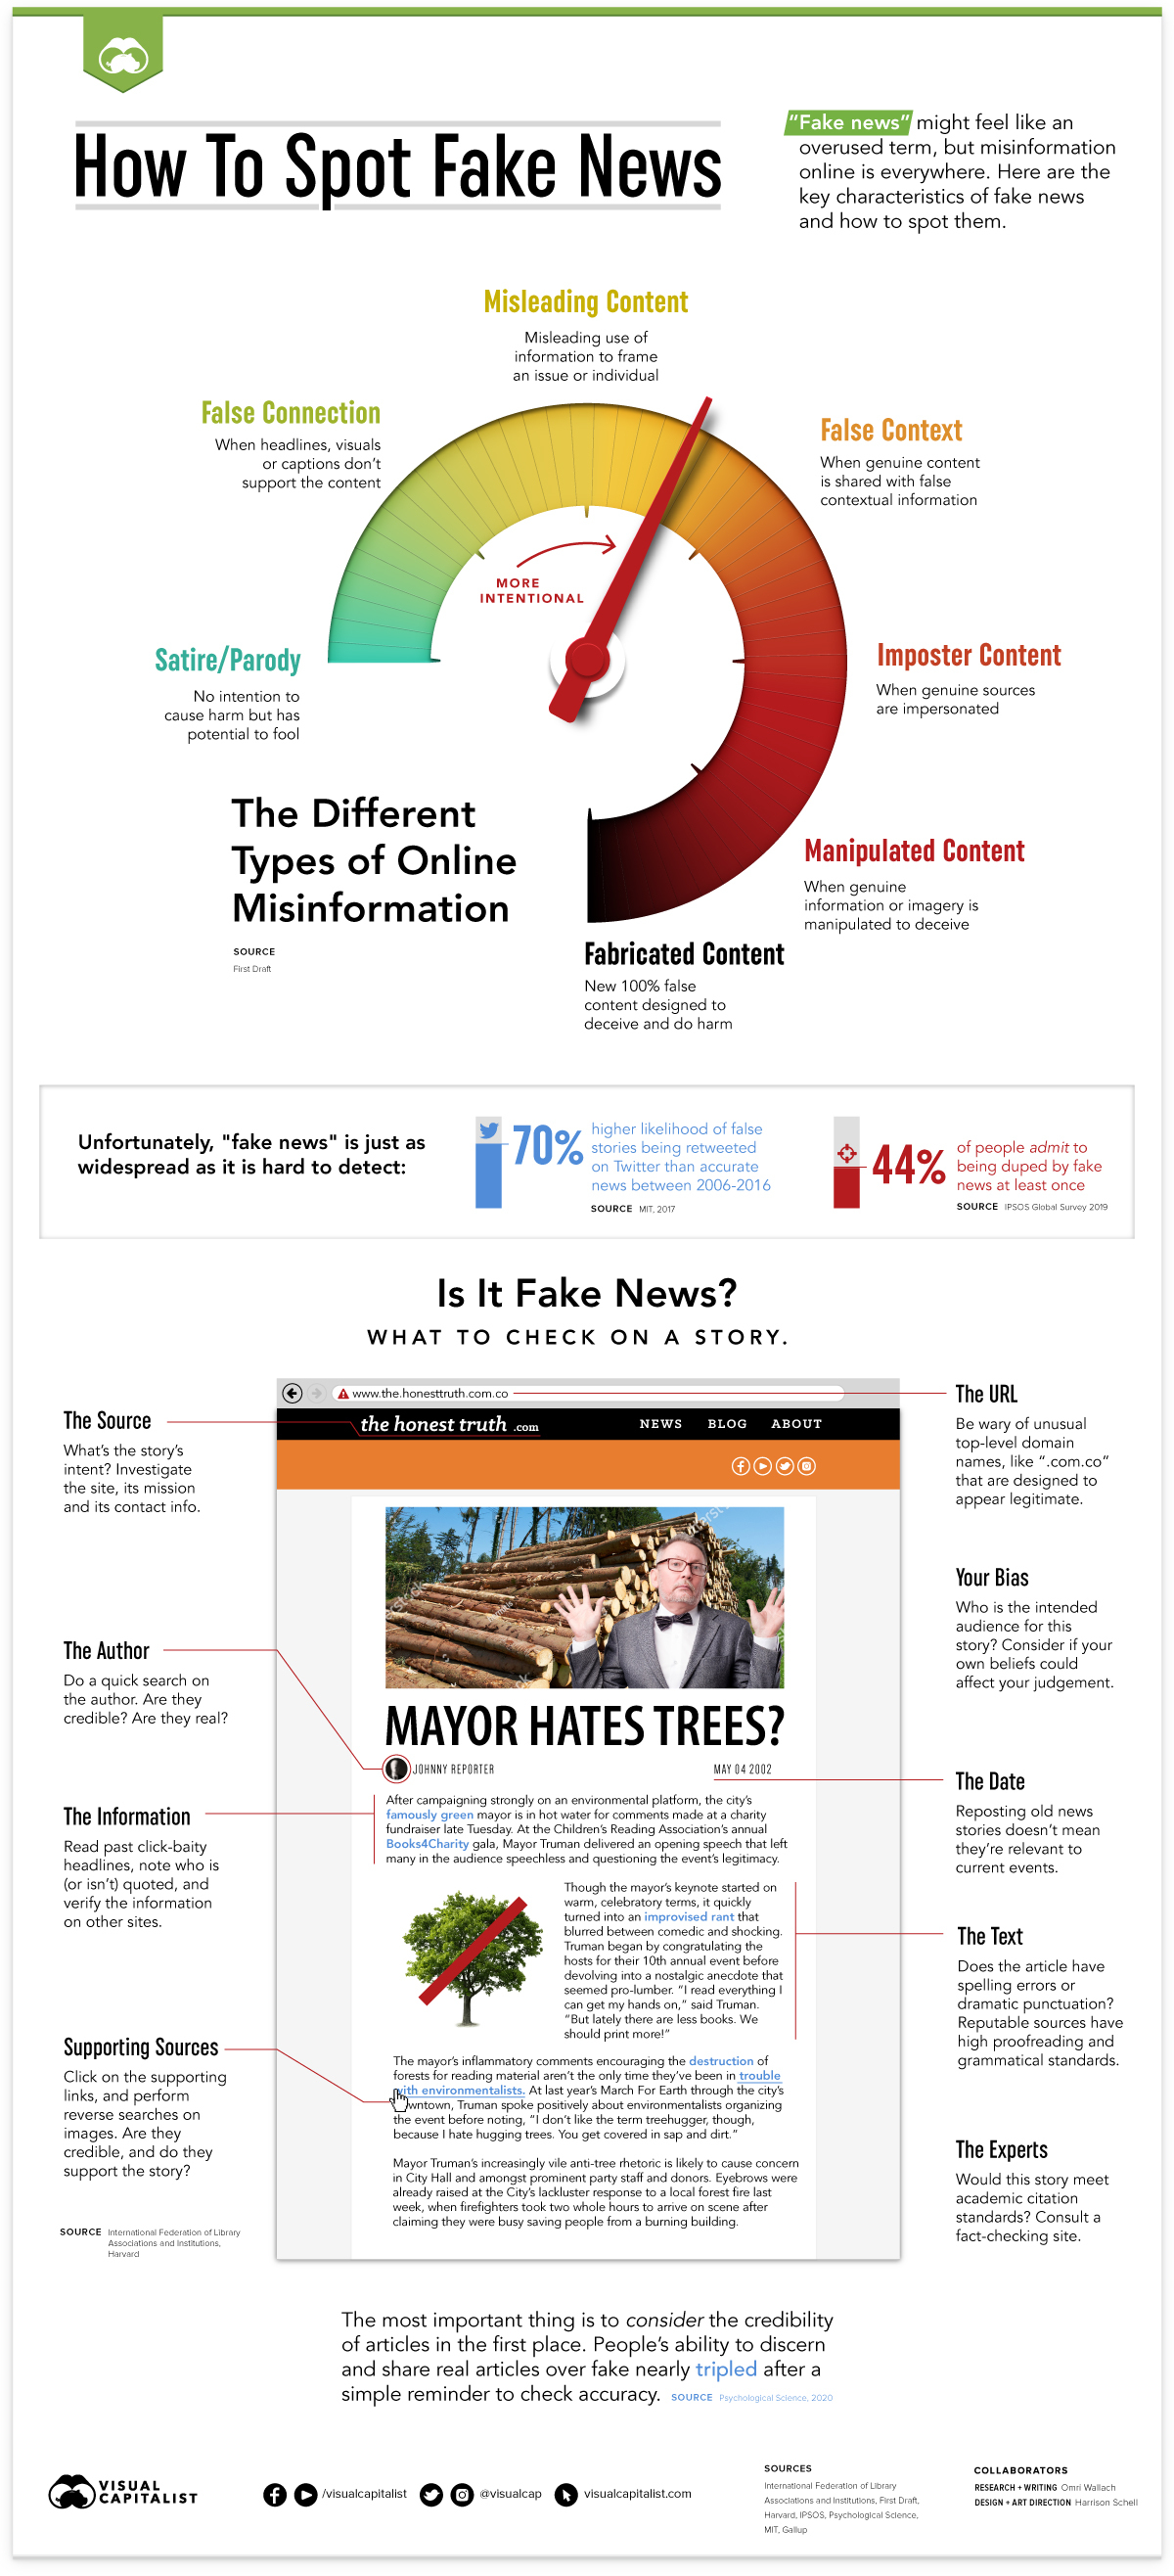
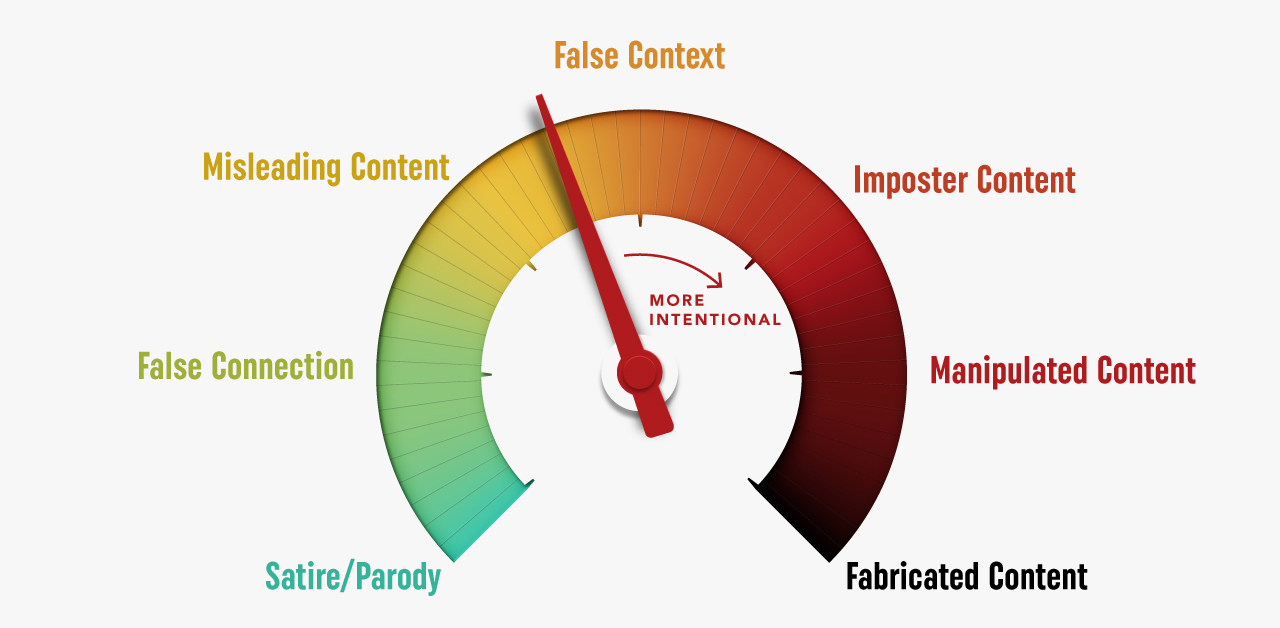
Online Misinformation From Least Intentional to Most
- Satire/Parody
Articles or videos created to mock or laugh at an issue. If created without being an obvious parody, these types of articles can still fool readers and be shared as “real.” - False Connection
Stories with headlines, visuals, and captions that don’t support the content. Sometimes the cause is an honest mistake or poor journalism, but other times the false connections are deliberate to draw more attention. - Misleading Content
Misleading use of information to frame an issue or individual, especially one not involved in the story. This can be caused by poor journalism or political influence, but is also caused by opinions being shared as news and the increasingly blurring line between the two. - False Context
Genuine content that is shared with false contextual information, such as an incorrect date or a misattributed quote. This type of misinformation can still appear on news sites with poor fact-checking or opinion-based reporting, but is clearly driven by an agenda with an attempt to influence. - Imposter Content
When genuine sources are impersonated in order to deceive the audience. Though this type of misinformation is used in parody, it is also used for profit and propaganda purposes, such as by sites disguised to look like news organizations or using fake credentials. - Manipulated Content
The deliberate manipulation of information, such as digitally altering an image or making up quotes. This type of misinformation is easily proven fake with some research, but can spread too far before it is fact-checked. - Fabricated Content
Newly created false content designed to deceive and do harm. These include deepfake videos and sites posing as legitimate news organizations.
Despite many types of misinformation appearing to be obvious at a glance, it’s harder to discern when browsing online. In a 2019 global survey on social media by Ipsos, 44% of people admitted to being duped by fake news at least once, while others may have been duped unwittingly.
And one reason is that fake or provocative news are simply being spread further, and more maliciously. A recent study of one Facebook bot farm found close to 14 thousand bots published around 200 thousand posts each month.
How To Tell If An Article is “Fake News”
With many types of misinformation to contend with, and trust in media organizations falling in the U.S. and around the world, it might seem like you’re surrounded by “fake news,” but there are a few things you can check to be sure.
- The Source
Investigate the site to make sure it’s legitimate, and check its mission and its contact info to understand if it’s news, satire, or opinion. - The URL
Be wary of unusual top-level domain names, like “.com.co” that are designed to appear legitimate, such as ABCnews.com.co. - The Text
Does the article have spelling errors or dramatic punctuation? This can be an easy find for simple fabricated content, as most reputable sources have high proofreading and grammatical standards. - The Information
Read past click-baity headlines, note who is (or isn’t) quoted, and verify the information on other sites. This is also a good way to separate opinion pieces from news. - The Author
Check the author’s bio and do a quick search on them. Are they credible to write about their story? Are they real? - Supporting Sources
Click on the supporting links, and perform reverse searches on images. Do they actually support the story, or are they irrelevant (or worse, manipulated). - The Date
Sometimes older news stories are shared again and gain traction because of current events, but that doesn’t mean they’re relevant or accurate. - Your Bias
Especially with the rise of opinionated journalism and websites profiting from polarization, consider the intended audience for this story and if your own beliefs could affect your judgement. - The Experts
If a story feels flimsy, or doesn’t seem to be properly cited, consider asking an expert in the field or consulting a fact-checking site.
More than anything, consider that outrageous misinformation has an easier time spreading on the internet than boring real news. An MIT study found that false stories on Twitter were 70% more likely to get retweeted than accurate news.
But armed with knowledge about what “fake news” looks like, and with increased pressure on news organizations, the tide can be turned back in the favor of accurate news.


Demographics
Ranked: Countries Where Youth are the Most Unhappy, Relative to Older Generations
Conventional wisdom says that young adults (those below 30) tend to be the happiest demographic—but this is not true for these countries.
Countries with the Biggest Happiness Gaps Between Generations
This was originally posted on our Voronoi app. Download the app for free on iOS or Android and discover incredible data-driven charts from a variety of trusted sources.
“They say a person needs just three things to be truly happy in this world: someone to love, something to do, and something to hope for.” — Tom Bodett
Measuring happiness is tricky business, more so when taking into account how different regions, cultures, and faiths define it. Nevertheless, the World Happiness Report attempts to distill being happy into a single score out of 10, and then ranks countries by their average score.
We’ve visualized the high-level findings from the latest happiness report in this series of maps. However, the report also dives deeper into other significant trends in the data, such as a growing disparity in happiness between age groups within countries themselves.
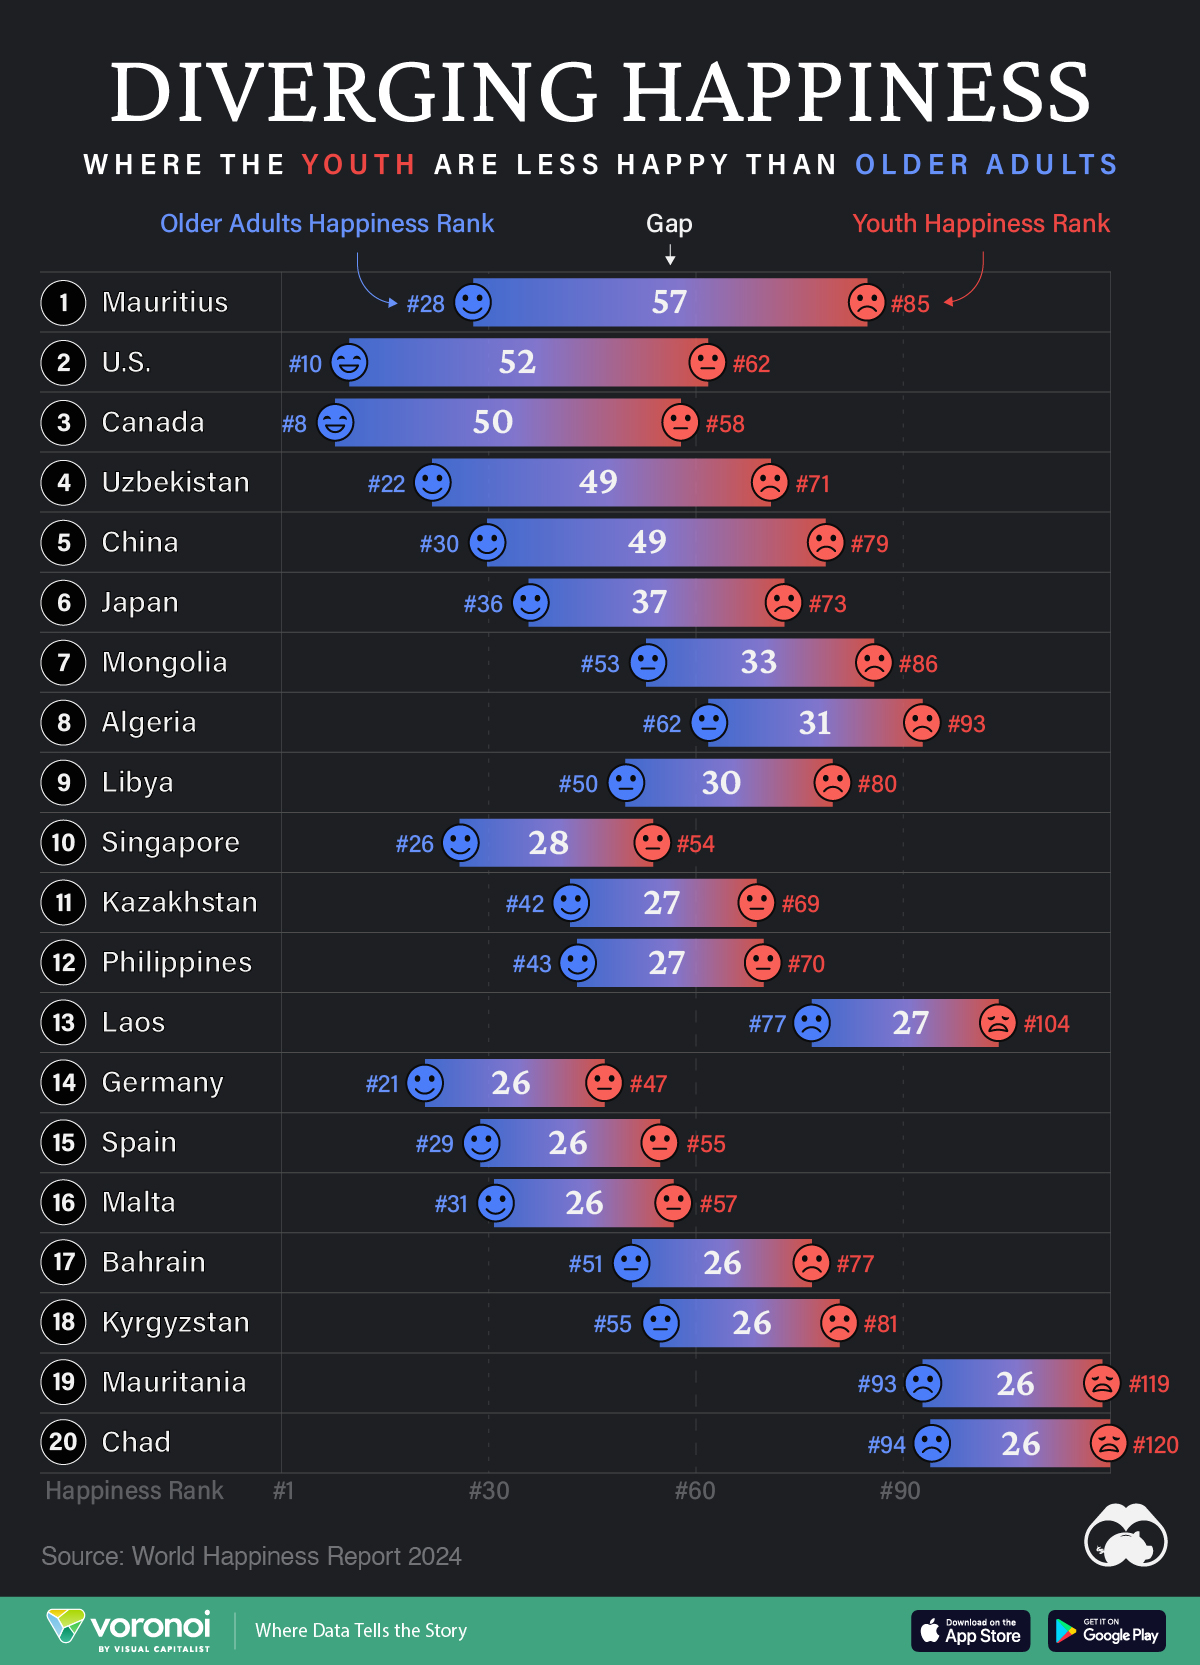
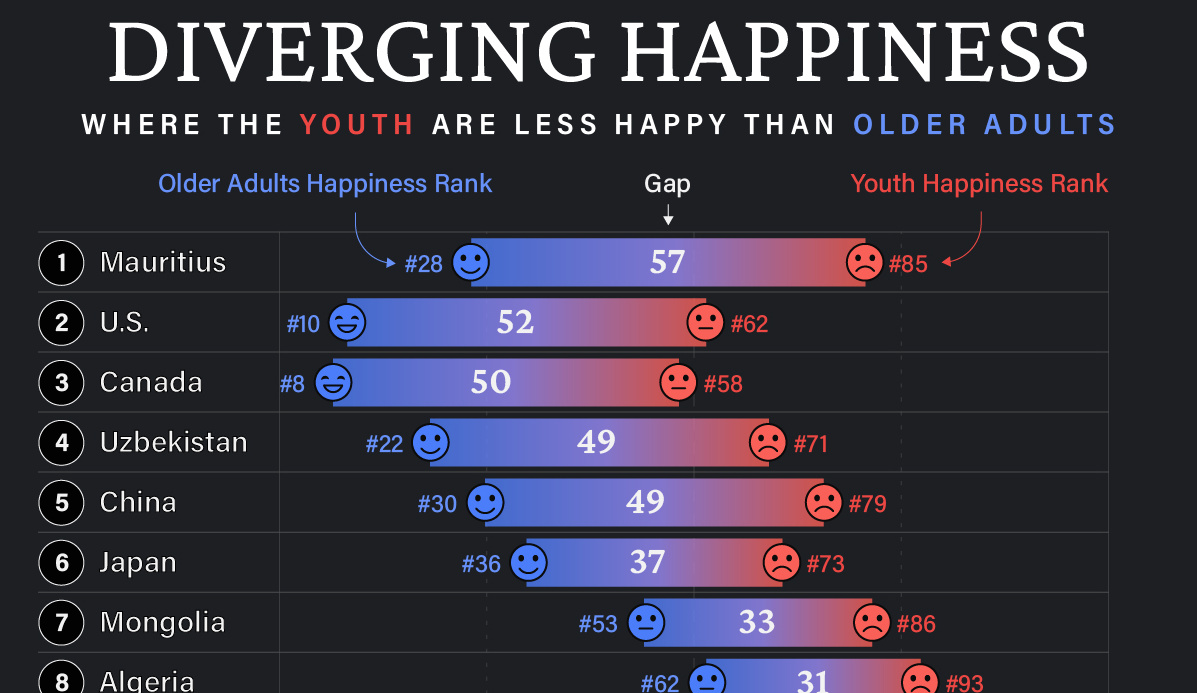
In the chart above, we list countries by the biggest gaps in happiness ranks between young adults (<30) and older adults (60+). A higher number indicates a larger gap, and that the youth are far unhappier than their older counterparts.
Where are Youth Unhappier than Older Adults?
Mauritius ranks first on this list, with a massive 57 place gap between older adult and youth happiness. The 1.26 million-inhabited island nation briefly reached high income status in 2020, but the pandemic hit hard, hurting its key tourism sector, and affecting jobs.
The country’s youth unemployment rate spiked to close to 25% that year, but has since been on the decline. Like residents on many similarly-populated islands, the younger demographic often moves abroad in search of more opportunities.
| Rank | Country | Youth Happiness Rank | Older Adult Happiness Rank | Happiness Gap |
|---|---|---|---|---|
| 1 | 🇲🇺 Mauritius | 85 | 28 | 57 |
| 2 | 🇺🇸 U.S. | 62 | 10 | 52 |
| 3 | 🇨🇦 Canada | 58 | 8 | 50 |
| 4 | 🇺🇿 Uzbekistan | 71 | 22 | 49 |
| 5 | 🇨🇳 China | 79 | 30 | 49 |
| 6 | 🇯🇵 Japan | 73 | 36 | 37 |
| 7 | 🇲🇳 Mongolia | 86 | 53 | 33 |
| 8 | 🇩🇿 Algeria | 93 | 62 | 31 |
| 9 | 🇱🇾 Libya | 80 | 50 | 30 |
| 10 | 🇸🇬 Singapore | 54 | 26 | 28 |
| 11 | 🇰🇿 Kazakhstan | 69 | 42 | 27 |
| 12 | 🇵🇭 Philippines | 70 | 43 | 27 |
| 13 | 🇱🇦 Laos | 104 | 77 | 27 |
| 14 | 🇩🇪 Germany | 47 | 21 | 26 |
| 15 | 🇪🇸 Spain | 55 | 29 | 26 |
| 16 | 🇲🇹 Malta | 57 | 31 | 26 |
| 17 | 🇧🇭 Bahrain | 77 | 51 | 26 |
| 18 | 🇰🇬 Kyrgyzstan | 81 | 55 | 26 |
| 19 | 🇲🇷 Mauritania | 119 | 93 | 26 |
| 20 | 🇹🇩 Chad | 120 | 94 | 26 |
Conventional wisdom says, and data somewhat correlates, that young adults (those below 30) tend to be the happiest demographic. Happiness then decreases through middle age and starts increasing around 60. However, the above countries are digressing from the pattern, with older generations being much happier than young adults.
That older generations are happier, by itself, is not a bad thing. However, that younger adults are so much unhappier in the same country can point to several unique stresses that those aged below 30 are facing.
For example, in the U.S. and Canada—both near the top of this list—many young adults feel like they have been priced out of owning a home: a once key metric of success.
Climate anxieties are also high, with worries about the future of the world they’ll inhabit. Finally, persistent economic inequities are also weighing on the younger generation, with many in that cohort feeling like they will never be able to afford to retire.
All of this comes alongside a rising loneliness epidemic, where those aged 18–25 report much higher rates of loneliness than the general population.
Source: The World Happiness Report which leverages data from the Gallup World Poll.
Methodology: A nationally representative group of approximately 1,000 people per country are asked to evaluate their life on a scale of 0–10. Scores are averaged across generations per country over three years. Countries are ranked by their scores out of 10.

-

 United States6 days ago
Mapped: Countries Where Recreational Cannabis is Legal
-

 Healthcare2 weeks ago
Life Expectancy by Region (1950-2050F)
-

 Markets2 weeks ago
The Growth of a $1,000 Equity Investment, by Stock Market
-

 Markets2 weeks ago
Mapped: Europe’s GDP Per Capita, by Country
-

 Money2 weeks ago
Charted: What Frustrates Americans About the Tax System
-

 Technology2 weeks ago
Countries With the Highest Rates of Crypto Ownership
-

 Mining2 weeks ago
Where the World’s Aluminum is Smelted, by Country
-

 Personal Finance2 weeks ago
Visualizing the Tax Burden of Every U.S. State