Misc
Iconic Infographic Map Compares the World’s Mountains and Rivers
Explore the full-size version (19mb) of this visualization.

Today, highly detailed maps of our planet’s surface are just a click away.
In times past, however, access to information was much more limited. It wasn’t until the 1800s that comparison diagrams and maps became widely accessible, and people found new ways to learn about the world around them.
The image above, published by J.H. Colton in 1849, is believed to be the first edition of the iconic mountains and rivers infographic map. This comparison chart concept would see a number of iterations over the years as it appeared in Colton’s world atlases.
Inspiring a Classic Infographic Map
A seminal example of this style of infographic was produced by Alexander von Humboldt in 1805. The diagram below is packed with information and shows geographical features in a way that was extremely novel at the time.

In 1817, the brothers William and Daniel Lizars produced the first comparative chart of the world’s mountains and rivers. Breaking up individual natural features into components for comparison was a very innovative approach at that time, and it was this early French language prototype that lead to the Colton’s versions we’re familiar with today.
Digging into the Details
As is obvious, even at first glance, there is a ton of detail packed into this infographic map.
Firstly, rivers are artificially straightened and neatly arranged in rows for easy comparison. Lakes, mountain ranges, and cities are all labeled along the way. This unique comparison brings cities like New Orleans and Cairo side by side.
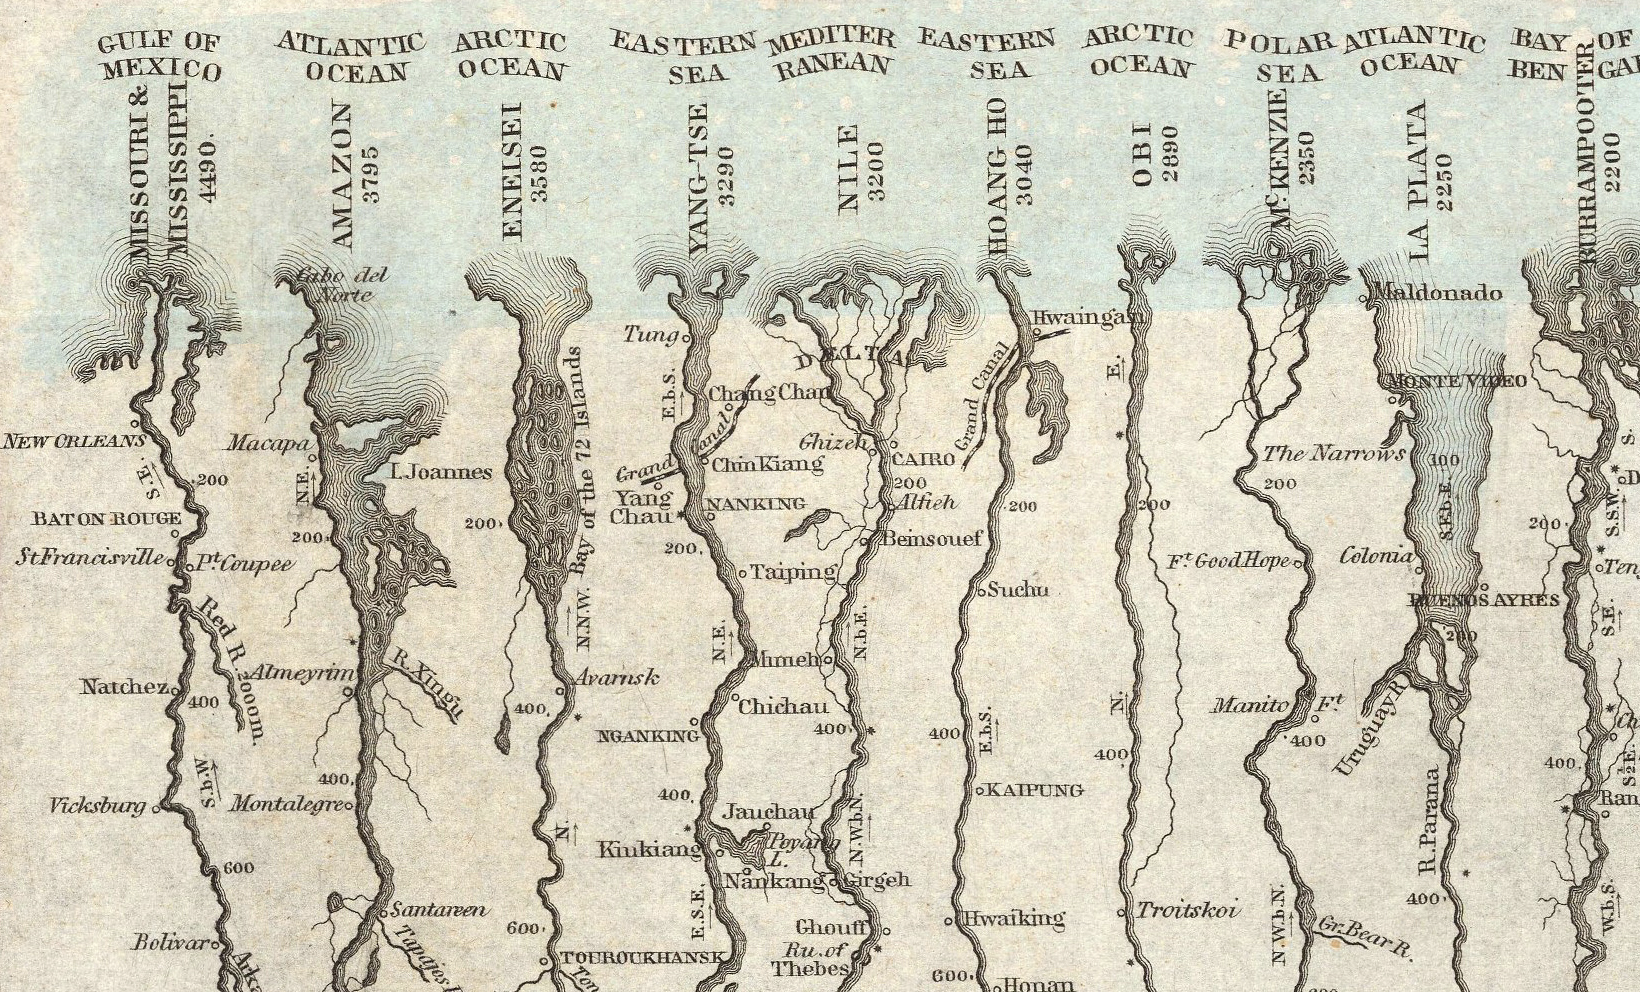
Of course, this visualization was based on the best available data at the time. Today, the Nile is widely considered to be the world’s longest river, followed by the Amazon and Yangtze.
Over on the mountain side, there are more details to take in. The visualization includes volcanic activity, notes on vegetation, and even the altitude of selected cities and towns.

Above are a few of South America’s high-altitude population centers, including La Paz, which is the highest-elevation capital city in the world.
In the legend, many of the mountains are simply named “peak”. While this generic labeling might seem like a throwback to a time when the world was still being explored, it’s worth noting that today’s second tallest mountain is still simply referred to as K2.
What details do you notice while exploring this iconic infographic map?


Maps
Mapped: The 10 U.S. States With the Lowest Real GDP Growth
In this graphic, we show where real GDP lagged the most across America in 2023 as high interest rates weighed on state economies.


The Top 10 U.S. States, by Lowest Real GDP Growth
This was originally posted on our Voronoi app. Download the app for free on iOS or Android and discover incredible data-driven charts from a variety of trusted sources.
While the U.S. economy defied expectations in 2023, posting 2.5% in real GDP growth, several states lagged behind.
Last year, oil-producing states led the pack in terms of real GDP growth across America, while the lowest growth was seen in states that were more sensitive to the impact of high interest rates, particularly due to slowdowns in the manufacturing and finance sectors.
This graphic shows the 10 states with the least robust real GDP growth in 2023, based on data from the Bureau of Economic Analysis.
Weakest State Economies in 2023
Below, we show the states with the slowest economic activity in inflation-adjusted terms, using chained 2017 dollars:
| Rank | State | Real GDP Growth 2023 YoY | Real GDP 2023 |
|---|---|---|---|
| 1 | Delaware | -1.2% | $74B |
| 2 | Wisconsin | +0.2% | $337B |
| 3 | New York | +0.7% | $1.8T |
| 4 | Missississippi | +0.7% | $115B |
| 5 | Georgia | +0.8% | $661B |
| 6 | Minnesota | +1.2% | $384B |
| 7 | New Hampshire | +1.2% | $91B |
| 8 | Ohio | +1.2% | $698B |
| 9 | Iowa | +1.3% | $200B |
| 10 | Illinois | +1.3% | $876B |
| U.S. | +2.5% | $22.4T |
Delaware witnessed the slowest growth in the country, with real GDP growth of -1.2% over the year as a sluggish finance and insurance sector dampened the state’s economy.
Like Delaware, the Midwestern state of Wisconsin also experienced declines across the finance and insurance sector, in addition to steep drops in the agriculture and manufacturing industries.
America’s third-biggest economy, New York, grew just 0.7% in 2023, falling far below the U.S. average. High interest rates took a toll on key sectors, with notable slowdowns in the construction and manufacturing sectors. In addition, falling home prices and a weaker job market contributed to slower economic growth.
Meanwhile, Georgia experienced the fifth-lowest real GDP growth rate. In March 2024, Rivian paused plans to build a $5 billion EV factory in Georgia, which was set to be one of the biggest economic development initiatives in the state in history.
These delays are likely to exacerbate setbacks for the state, however, both Kia and Hyundai have made significant investments in the EV industry, which could help boost Georgia’s manufacturing sector looking ahead.

-

 Technology1 week ago
Countries With the Highest Rates of Crypto Ownership
-

 Mining6 days ago
Visualizing Copper Production by Country in 2023
-

 Politics7 days ago
Charted: How Americans Feel About Federal Government Agencies
-

 Healthcare1 week ago
Which Countries Have the Highest Infant Mortality Rates?
-

 Demographics1 week ago
Mapped: U.S. Immigrants by Region
-

 Economy1 week ago
Mapped: Southeast Asia’s GDP Per Capita, by Country
-

 Automotive1 week ago
How People Get Around in America, Europe, and Asia
-

 Personal Finance1 week ago
Visualizing the Tax Burden of Every U.S. State