Misc
What Types of People Appear Most on International Currencies?
Article/Editing:
What Types of People Appear Most on International Currencies?
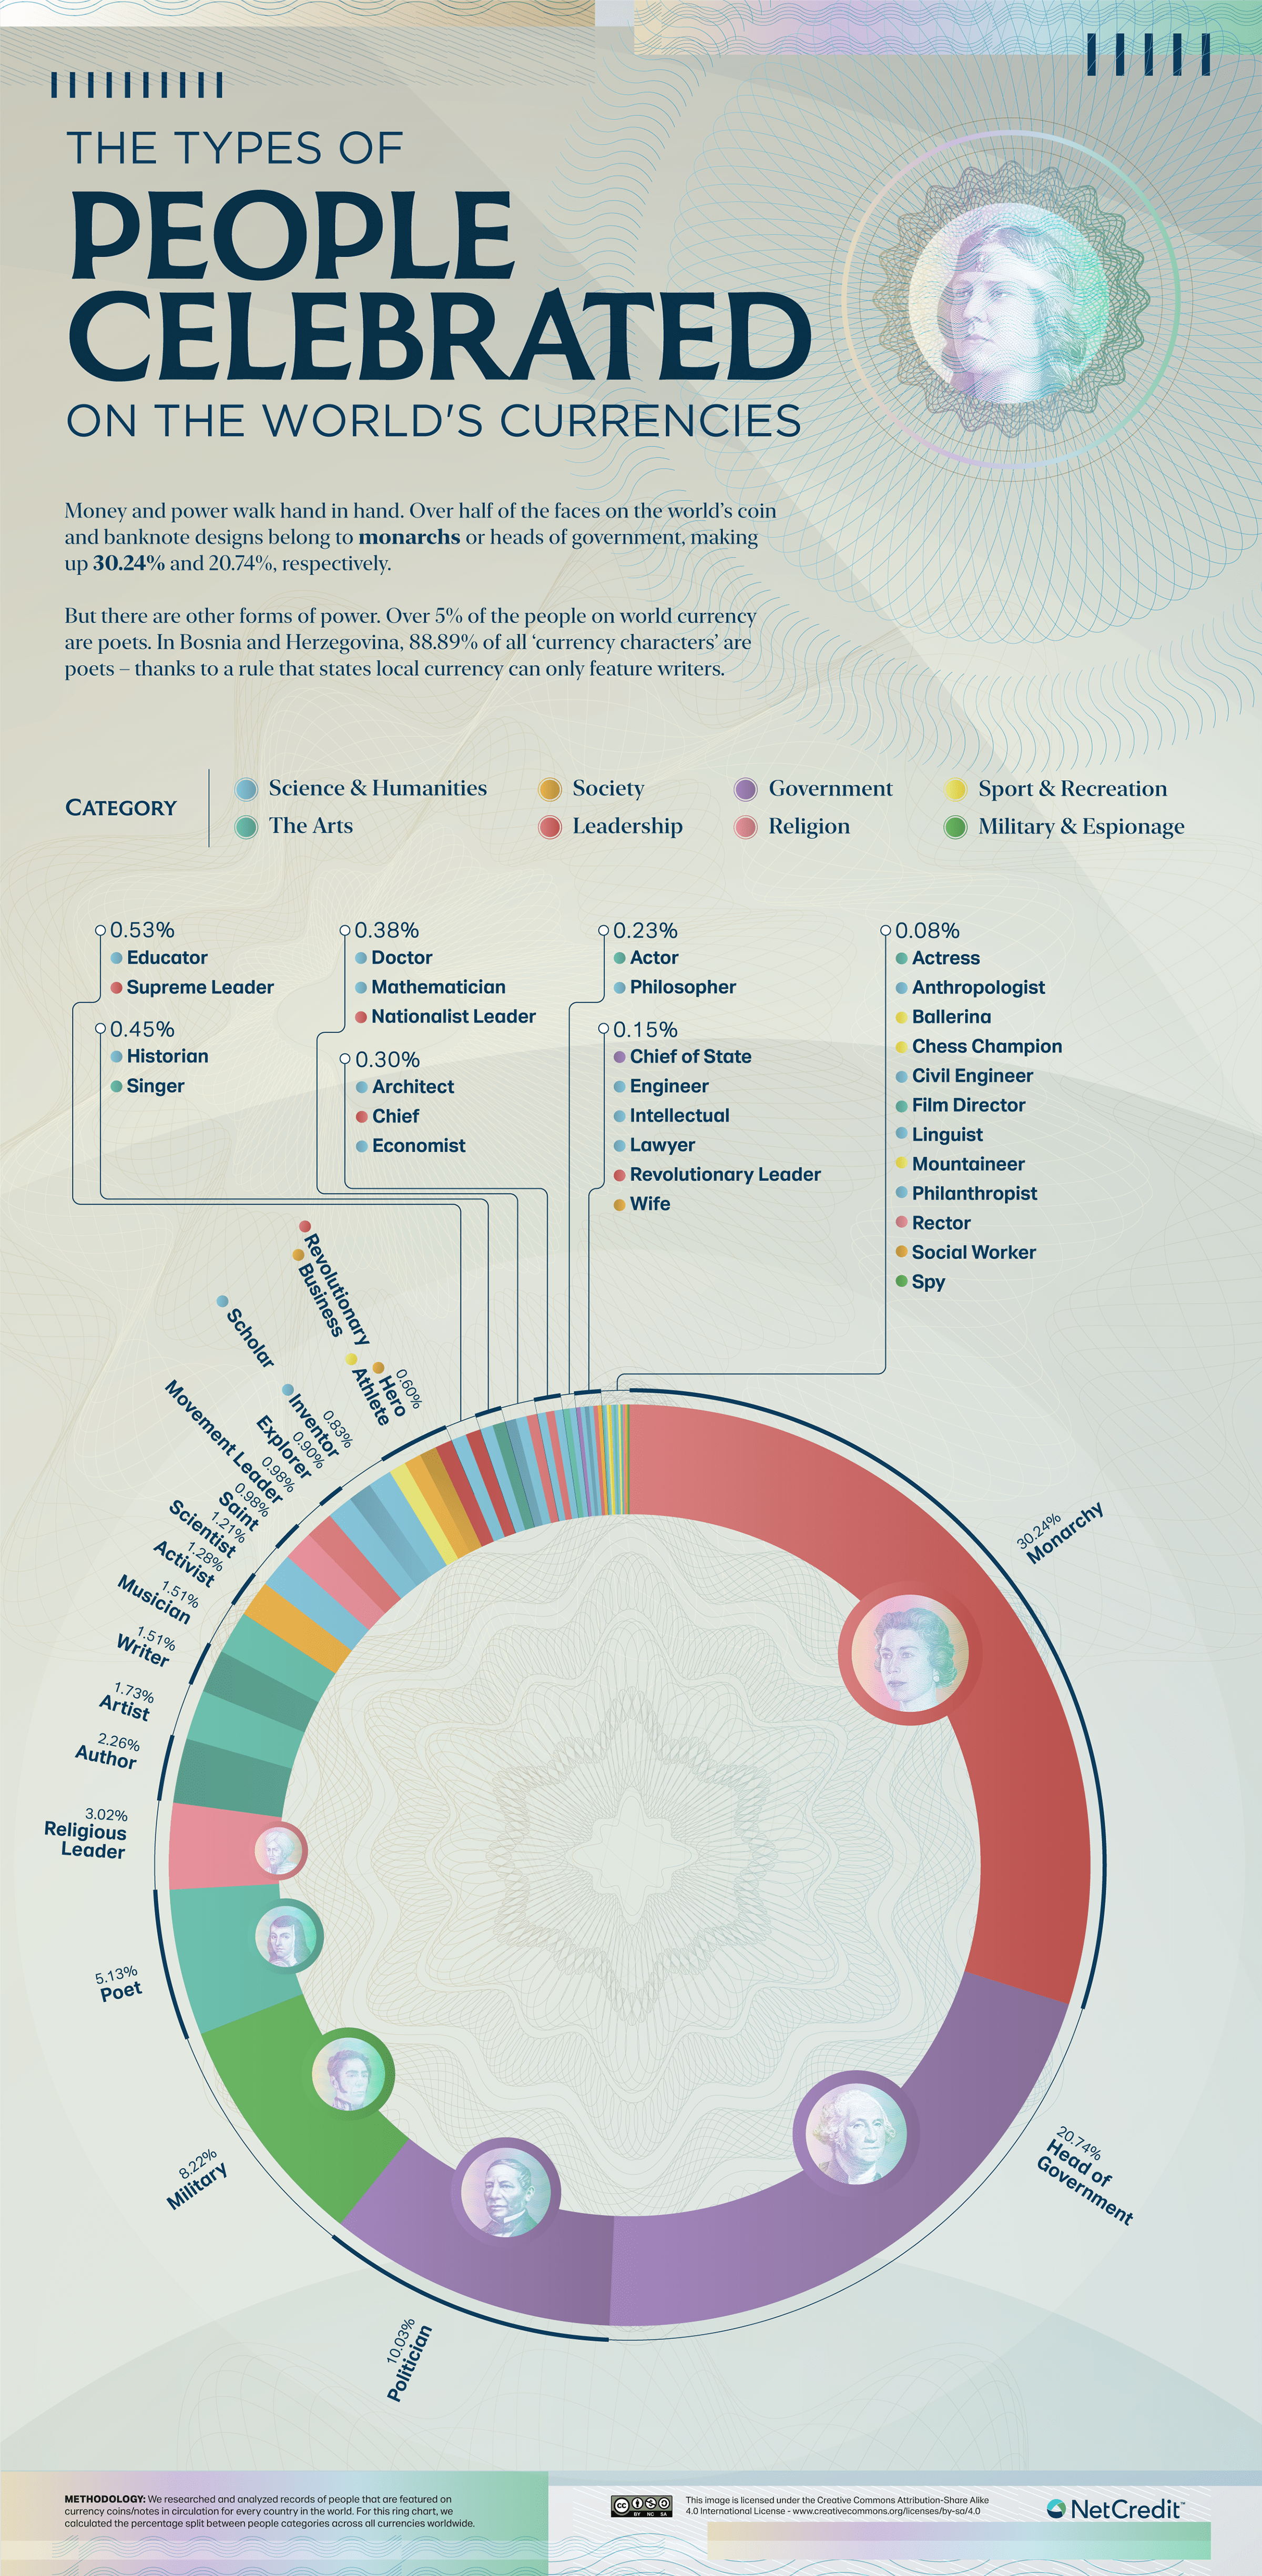
On currencies throughout the world, you’ll see everything from revolutionaries to poets featured prominently. But how does this mix of notable people break down quantitatively?
This graphic by NetCredit shows the types of people, by their main occupations and roles, that are featured on banknotes and coins worldwide.
Global Money Features Power
To find out the types of people most featured on money, NetCredit analyzed all the banknotes and coins in circulation in every country across the globe in 2022.
From monarchs to athletes, the analysis found that many types of people appear on banknotes and coins worldwide. In fact, 51 different main occupations and roles were identified, which were then organized into eight overarching categories:
- Leadership
- Government
- Society
- Sport & Recreation
- Military & Espionage
- Religion
- The Arts
- Humanity
Here’s a breakdown of all 51 different occupations, and what percentage of worldwide currencies they’re featured on:
| Occupation | Category | % on Currencies |
|---|---|---|
| Monarch | Leadership | 30.24% |
| Head of government | Government | 20.74% |
| Politician | Government | 10.03% |
| Military | Military & Esionage | 8.22% |
| Poet | The Arts | 5.13% |
| Religious leader | Religion | 3.02% |
| Author | The Arts | 2.26% |
| Artist | The Arts | 1.73% |
| Writer | The Arts | 1.51% |
| Musician | The Arts | 1.51% |
| Activist | Society | 1.28% |
| Scientist | Science & Humanities | 1.21% |
| Movement leader | Leadership | 0.98% |
| Saint | Religion | 0.98% |
| Explorer | Science & Humanities | 0.90% |
| Inventor | Science & Humanities | 0.83% |
| Scholar | Science & Humanities | 0.83% |
| Revolutionary | Leadership | 0.60% |
| Business | Society | 0.60% |
| Hero | Society | 0.60% |
| Athlete | Sport & Recreation | 0.60% |
| Supreme leader | Leadership | 0.53% |
| Educator | Science & Humanities | 0.53% |
| Historian | Science & Humanities | 0.45% |
| Singer | The Arts | 0.45% |
| Nationalist leader | Leadership | 0.38% |
| Doctor | Science & Humanities | 0.38% |
| Mathematician | Science & Humanities | 0.38% |
| Chief | Leadership | 0.30% |
| Architect | Science & Humanities | 0.30% |
| Economist | Science & Humanities | 0.30% |
| Philosopher | Science & Humanities | 0.23% |
| Actor | The Arts | 0.23% |
| Chief of state | Government | 0.15% |
| Revolutionary leader | Leadership | 0.15% |
| Intellectual | Science & Humanities | 0.15% |
| Lawyer | Science & Humanities | 0.15% |
| Wife | Society | 0.15% |
| Spy | Military & Esionage | 0.08% |
| Rector | Religion | 0.08% |
| Civil engineer | Science & Humanities | 0.08% |
| Linguist | Science & Humanities | 0.08% |
| Philanthropist | Science & Humanities | 0.08% |
| Anthropologist | Science and Humanities | 0.08% |
| Social worker | Society | 0.08% |
| Ballerina | Sport & Recreation | 0.08% |
| Chess champion | Sport & Recreation | 0.08% |
| Mountaineer | Sport & Recreation | 0.08% |
| Actress | The Arts | 0.08% |
| Film director | The Arts | 0.08% |
The analysis shows that over 50% of the people featured on money are either monarchs or heads of government, many of which are no longer in power.
For instance, Belize was once a British colony and still features the late Elizabeth II on all of its currency—even though the country gained independence from the UK in 1981.
And everyone featured on U.S. currency is also a historical figure. Putting living celebrities on U.S. money has been banned since 1866, after Spencer Clark, who was the Superintendent of the U.S. National Currency Bureau at the time, printed his own face on the 5-cent banknote instead of the explorer William Clark of “Lewis and Clark.”
International Currencies: The Most Popular Figure Heads
Featured on over 100 different currencies around the world, the late Elizabeth II is the most featured person on banknotes and coins.
This makes sense considering the UK’s widespread historical reach. During the height of its reign in the early 20th century, the British Empire ruled nearly a quarter of the world.
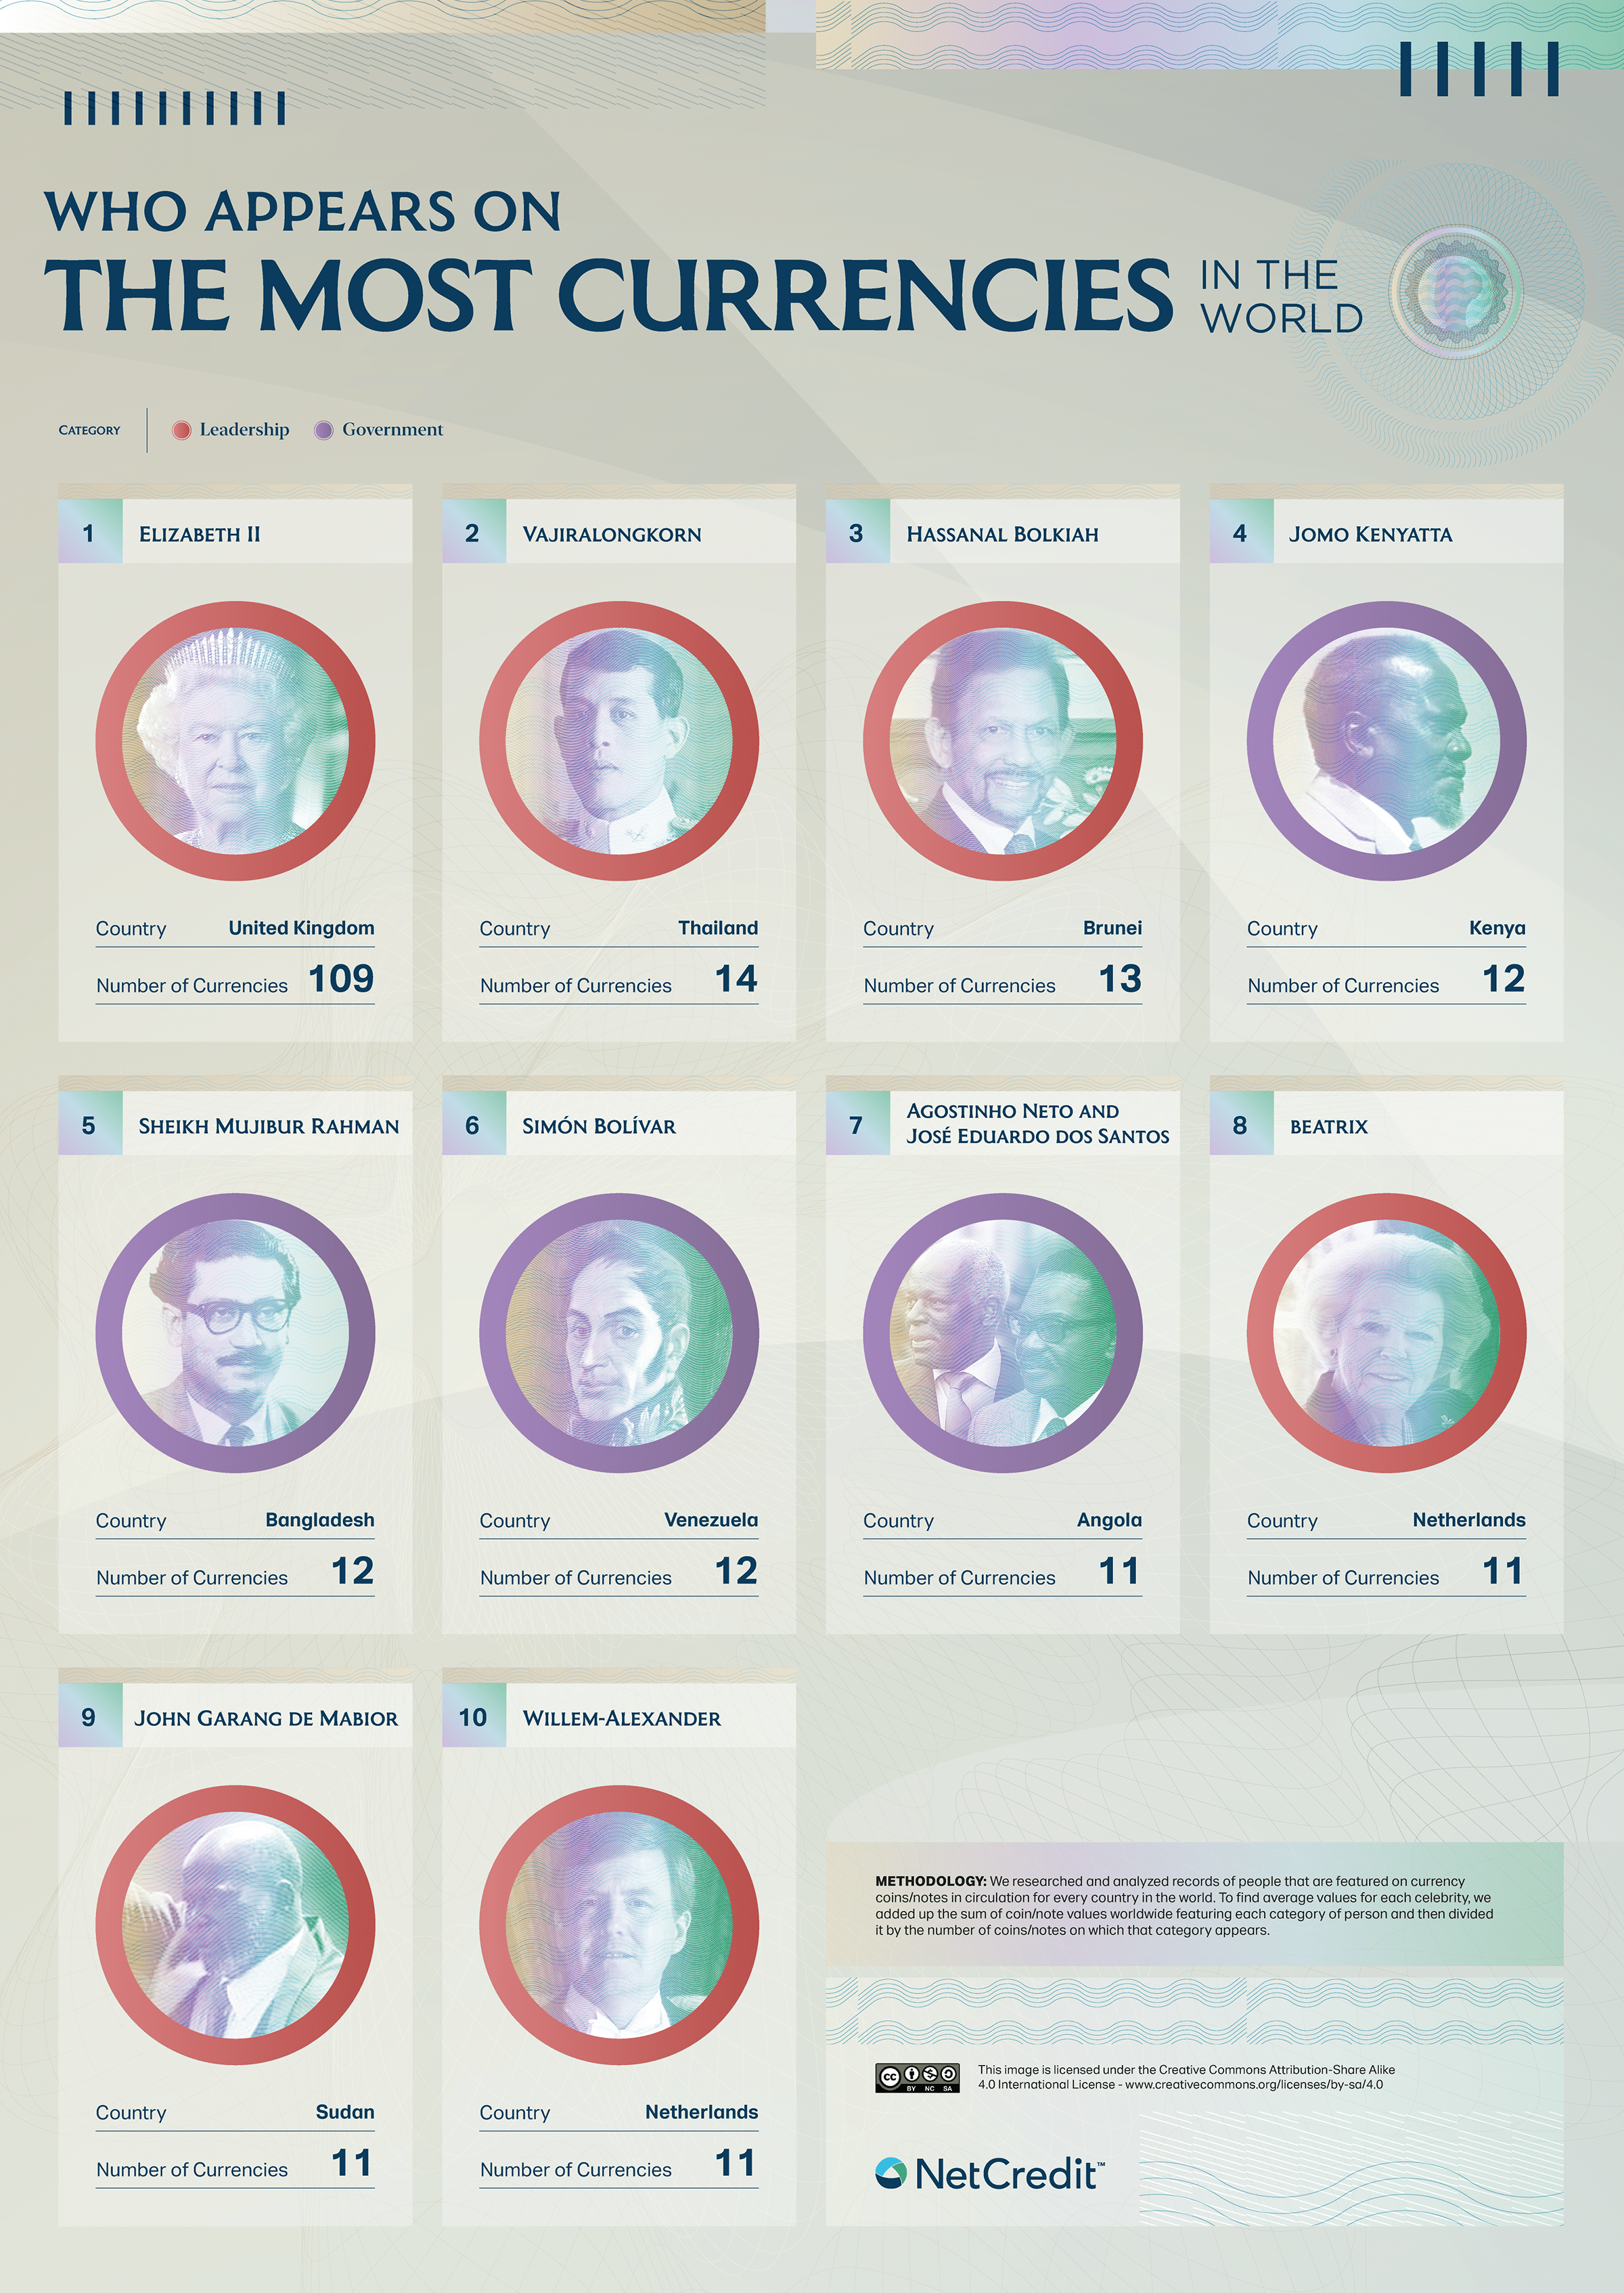
Perhaps unsurprisingly, 6 of the top 10 most-featured people on currencies are monarchs, while the rest are heads of government.
Women on Banknotes
While Elizabeth II is the most featured person on currencies around the world, it’s worth mentioning that few other women have been given the same honor.
A study analyzed 1,006 current international banknotes and found that only 15% featured images of women.
However, some countries are actively trying to celebrate more women on their money. For example, the U.S. has been planning to put Harriet Tubman on the U.S. $20 bill for years, and while there have been some delays, the bill is currently on track to get released by 2030.

This article was published as a part of Visual Capitalist's Creator Program, which features data-driven visuals from some of our favorite Creators around the world.


Misc
The Top 25 Nationalities of U.S. Immigrants
Mexico is the largest source of immigrants to the U.S., with almost 11 million immigrants.


The Top 25 Nationalities of U.S. Immigrants
This was originally posted on our Voronoi app. Download the app for free on iOS or Android and discover incredible data-driven charts from a variety of trusted sources.
The United States is home to more than 46 million immigrants, constituting approximately 14% of its total population.
This graphic displays the top 25 countries of origin for U.S. immigrants, based on 2022 estimates. The data is sourced from the Migration Policy Institute (MPI), which analyzed information from the U.S. Census Bureau’s 2022 American Community Survey.
In this context, “immigrants” refer to individuals residing in the United States who were not U.S. citizens at birth.
Mexico Emerges as a Leading Source of Immigration
Mexico stands out as the largest contributor to U.S. immigration due to its geographical proximity and historical ties.
Various economic factors, including wage disparities and employment opportunities, motivate many Mexicans to seek better prospects north of the border.
| Country | Region | # of Immigrants |
|---|---|---|
| 🇲🇽 Mexico | Latin America & Caribbean | 10,678,502 |
| 🇮🇳 India | Asia | 2,839,618 |
| 🇨🇳 China | Asia | 2,217,894 |
| 🇵🇭 Philippines | Asia | 1,982,333 |
| 🇸🇻 El Salvador | Latin America & Caribbean | 1,407,622 |
| 🇻🇳 Vietnam | Asia | 1,331,192 |
| 🇨🇺 Cuba | Latin America & Caribbean | 1,312,510 |
| 🇩🇴 Dominican Republic | Latin America & Caribbean | 1,279,900 |
| 🇬🇹 Guatemala | Latin America & Caribbean | 1,148,543 |
| 🇰🇷 Korea | Asia | 1,045,100 |
| 🇨🇴 Colombia | Latin America & Caribbean | 928,053 |
| 🇭🇳 Honduras | Latin America & Caribbean | 843,774 |
| 🇨🇦 Canada | Northern America | 821,322 |
| 🇯🇲 Jamaica | Latin America & Caribbean | 804,775 |
| 🇭🇹 Haiti | Latin America & Caribbean | 730,780 |
| 🇬🇧 United Kingdom | Europe | 676,652 |
| 🇻🇪 Venezuela | Latin America & Caribbean | 667,664 |
| 🇧🇷 Brazil | Latin America & Caribbean | 618,525 |
| 🇩🇪 Germany | Europe | 537,484 |
| 🇪🇨 Ecuador | Latin America & Caribbean | 518,287 |
| 🇵🇪 Peru | Latin America & Caribbean | 471,988 |
| 🇳🇬 Nigeria | Africa | 448,405 |
| 🇺🇦 Ukraine | Europe | 427,163 |
| 🇮🇷 Iran | Middle East | 407,283 |
| 🇵🇰 Pakistan | Asia | 399,086 |
| Rest of World | 11,637,634 | |
| Total | 46,182,089 |
Mexicans are followed in this ranking by Indians, Chinese, and Filipinos, though most immigrants on this list come from countries in the Latin American and Caribbean region.
On the other hand, only three European countries are among the top sources of U.S. immigrants: the UK, Germany, and Ukraine.
Immigration continues to be a significant factor contributing to the overall growth of the U.S. population. Overall population growth has decelerated over the past decade primarily due to declining birth rates.
Between 2021 and 2022, the increase in the immigrant population accounted for 65% of the total population growth in the U.S., representing 912,000 individuals out of nearly 1.4 million.
If you enjoyed this post, be sure to check out Visualized: Why Do People Immigrate to the U.S.? This visualization shows the different reasons cited by new arrivals to America in 2021.

-

 Personal Finance1 week ago
Visualizing the Tax Burden of Every U.S. State
-

 Misc6 days ago
Visualized: Aircraft Carriers by Country
-

 Culture7 days ago
How Popular Snack Brand Logos Have Changed
-

 Mining1 week ago
Visualizing Copper Production by Country in 2023
-

 Misc1 week ago
Charted: How Americans Feel About Federal Government Agencies
-

 Healthcare1 week ago
Which Countries Have the Highest Infant Mortality Rates?
-

 Demographics1 week ago
Mapped: U.S. Immigrants by Region
-

 Maps1 week ago
Mapped: Southeast Asia’s GDP Per Capita, by Country