Misc
Mapped: The Most Dangerous Time to Drive in Each U.S. State
Article/Editing:
The Most Dangerous Time to Drive in Each U.S. State
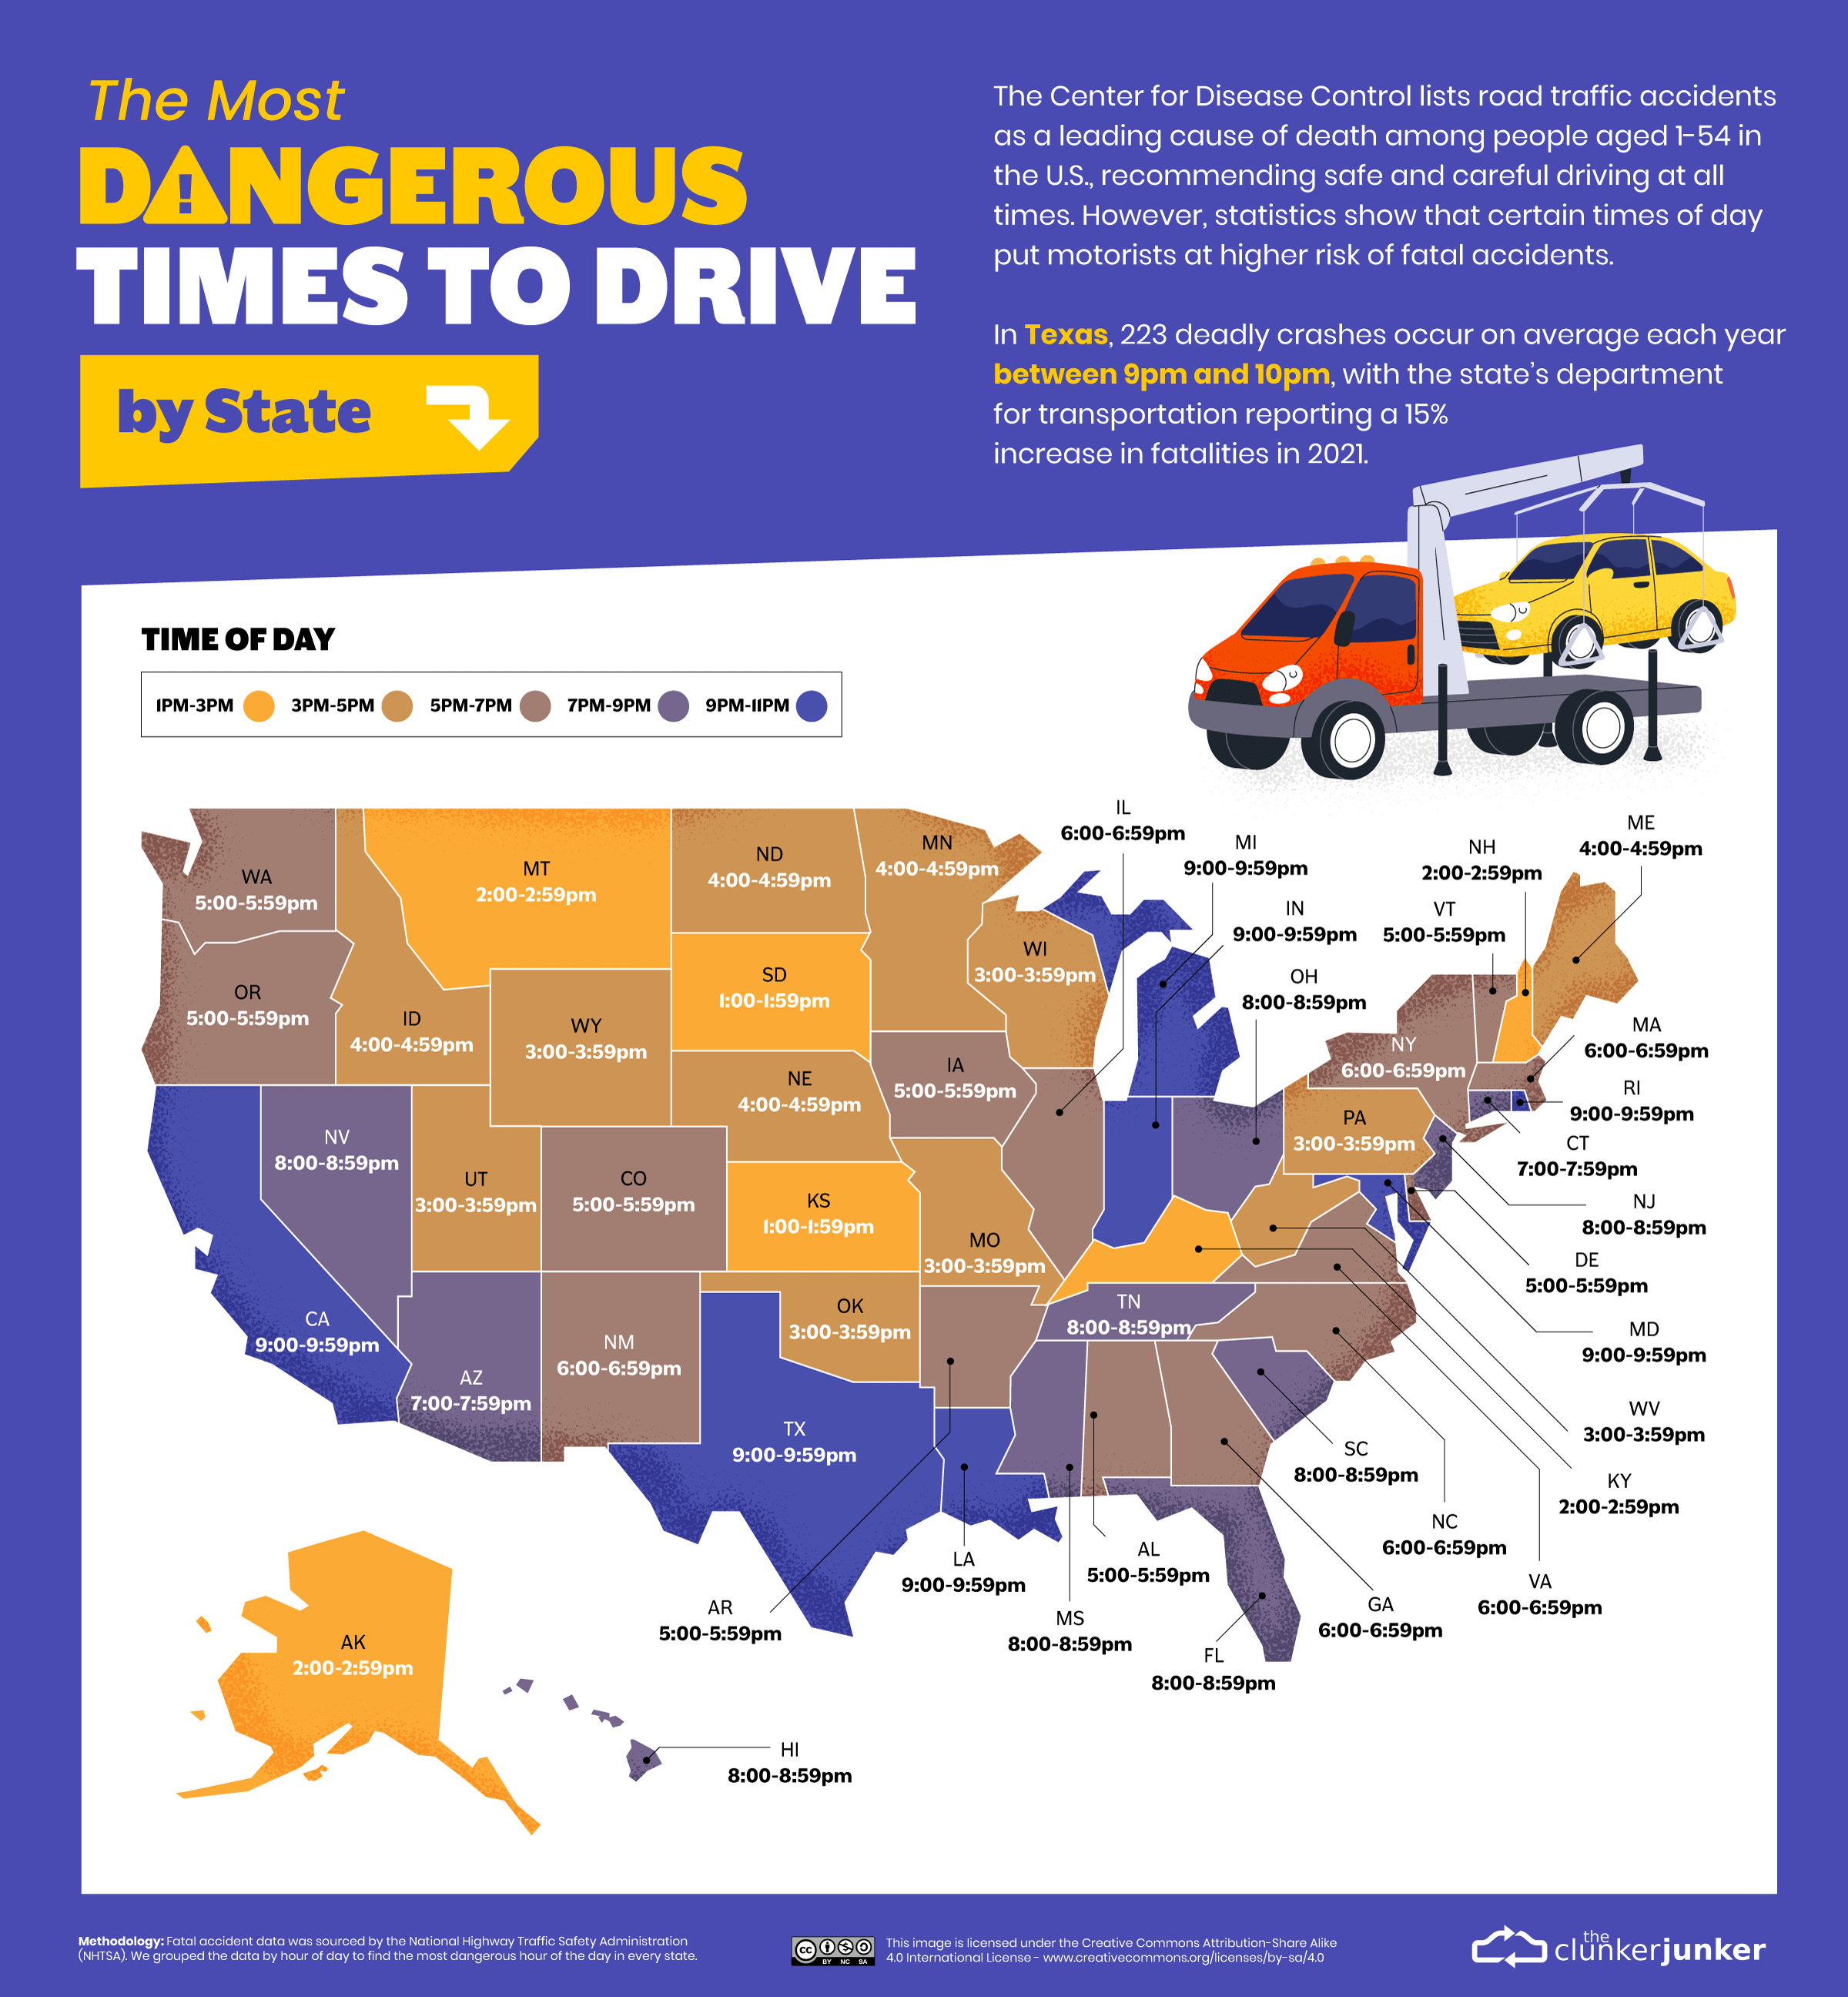
Thousands of commuters around the world lose their lives in vehicular accidents each year, and in the U.S., the most dangerous time to drive can actually depend on which state you’re in.
According to the CDC, car crashes are the eighth leading cause of death globally, and the leading cause for young people between the ages of 5–29 years old. Each day, the U.S. alone sees an average of 102 fatal traffic accidents.
This graphic by Clunker Junker uses data from the National Highway Traffic Safety Administration (NHTSA) to identify the most dangerous time to drive in each state of the country, based on traffic fatalities.
The Deadly Hours
On average, U.S. commuters lose over 50 hours of their time in rush hour traffic every year. In addition to being a frustrating drive, NHTSA data found that this time frame is also the most dangerous in some states.
The number of fatal traffic accidents across various parts of the U.S. increases after 5pm, peaking between 9pm and 10pm.
| State | Most Dangerous Time to Drive |
|---|---|
| Alabama | 5:00‒5:59 p.m. |
| Alaska | 2:00‒2:59 p.m. |
| Arizona | 7:00‒7:59 p.m. |
| Arkansas | 5:00‒5:59 p.m. |
| California | 9:00‒9:59 p.m. |
| Colorado | 5:00‒5:59 p.m. |
| Connecticut | 7:00‒7:59 p.m. |
| Delaware | 5:00‒5:59 p.m. |
| Florida | 8:00‒8:59 p.m. |
| Georgia | 6:00‒6:59 p.m. |
| Hawaii | 8:00‒8:59 p.m. |
| Idaho | 4:00‒4:59 p.m. |
| Illinois | 6:00‒6:59 p.m. |
| Indiana | 9:00‒9:59 p.m. |
| Iowa | 5:00‒5:59 p.m. |
| Kansas | 1:00‒1:59 p.m. |
| Kentucky | 2:00‒2:59 p.m. |
| Louisiana | 9:00‒9:59 p.m. |
| Maine | 4:00‒4:59 p.m. |
| Maryland | 9:00‒9:59 p.m. |
| Massachusetts | 6:00‒6:59 p.m. |
| Michigan | 9:00‒9:59 p.m. |
| Minnesota | 4:00‒4:59 p.m. |
| Mississippi | 8:00‒8:59 p.m. |
| Missouri | 3:00‒3:59 p.m. |
| Montana | 2:00‒2:59 p.m. |
| Nebraska | 4:00‒4:59 p.m. |
| Nevada | 8:00‒8:59 p.m. |
| New Hampshire | 2:00‒2:59 p.m. |
| New Jersey | 8:00‒8:59 p.m. |
| New Mexico | 6:00‒6:59 p.m. |
| New York | 6:00‒6:59 p.m. |
| North Carolina | 6:00‒6:59 p.m. |
| North Dakota | 4:00‒4:59 p.m. |
| Ohio | 8:00‒8:59 p.m. |
| Oklahoma | 3:00‒3:59 p.m. |
| Oregon | 5:00‒5:59 p.m. |
| Pennsylvania | 3:00‒3:59 p.m. |
| Rhode Island | 9:00‒9:59 p.m. |
| South Carolina | 8:00‒8:59 p.m. |
| South Dakota | 1:00‒1:59 p.m. |
| Tennessee | 8:00‒8:59 p.m. |
| Texas | 9:00‒9:59 p.m. |
| Utah | 3:00‒3:59 p.m. |
| Vermont | 5:00‒5:59 p.m. |
| Virginia | 6:00‒6:59 p.m. |
| Washington | 5:00‒5:59 p.m. |
| West Virginia | 3:00‒3:59 p.m. |
| Wisconsin | 3:00‒3:59 p.m. |
| Wyoming | 3:00‒3:59 p.m. |
This is reported to be an outcome of various factors: low visibility at night, glaring headlights, more cars on the road, and a higher number of drunk drivers. In some states, regional geography and weather also contribute to dangerous road conditions, including hills and mountains, rain, snow, and strong winds.
Another factor is congestion. More populated states with longer average commutes like California and Maryland had the most dangerous time to drive as later (between 9 p.m. to 10 p.m.), while central states with smaller populations like Kansas and South Dakota had earlier peak dangerous times (between 1 p.m. and 2 p.m.)
The safest times to drive across all states? Early in the morning from 3 a.m. to 5 a.m.
The Most Dangerous Time to Drive by Month and Day
While holidays are a time for relaxation and celebration, they can be hazardous on the roads.
According to NHTSA data, the summer and fall months are the most dangerous by average fatal accidents.
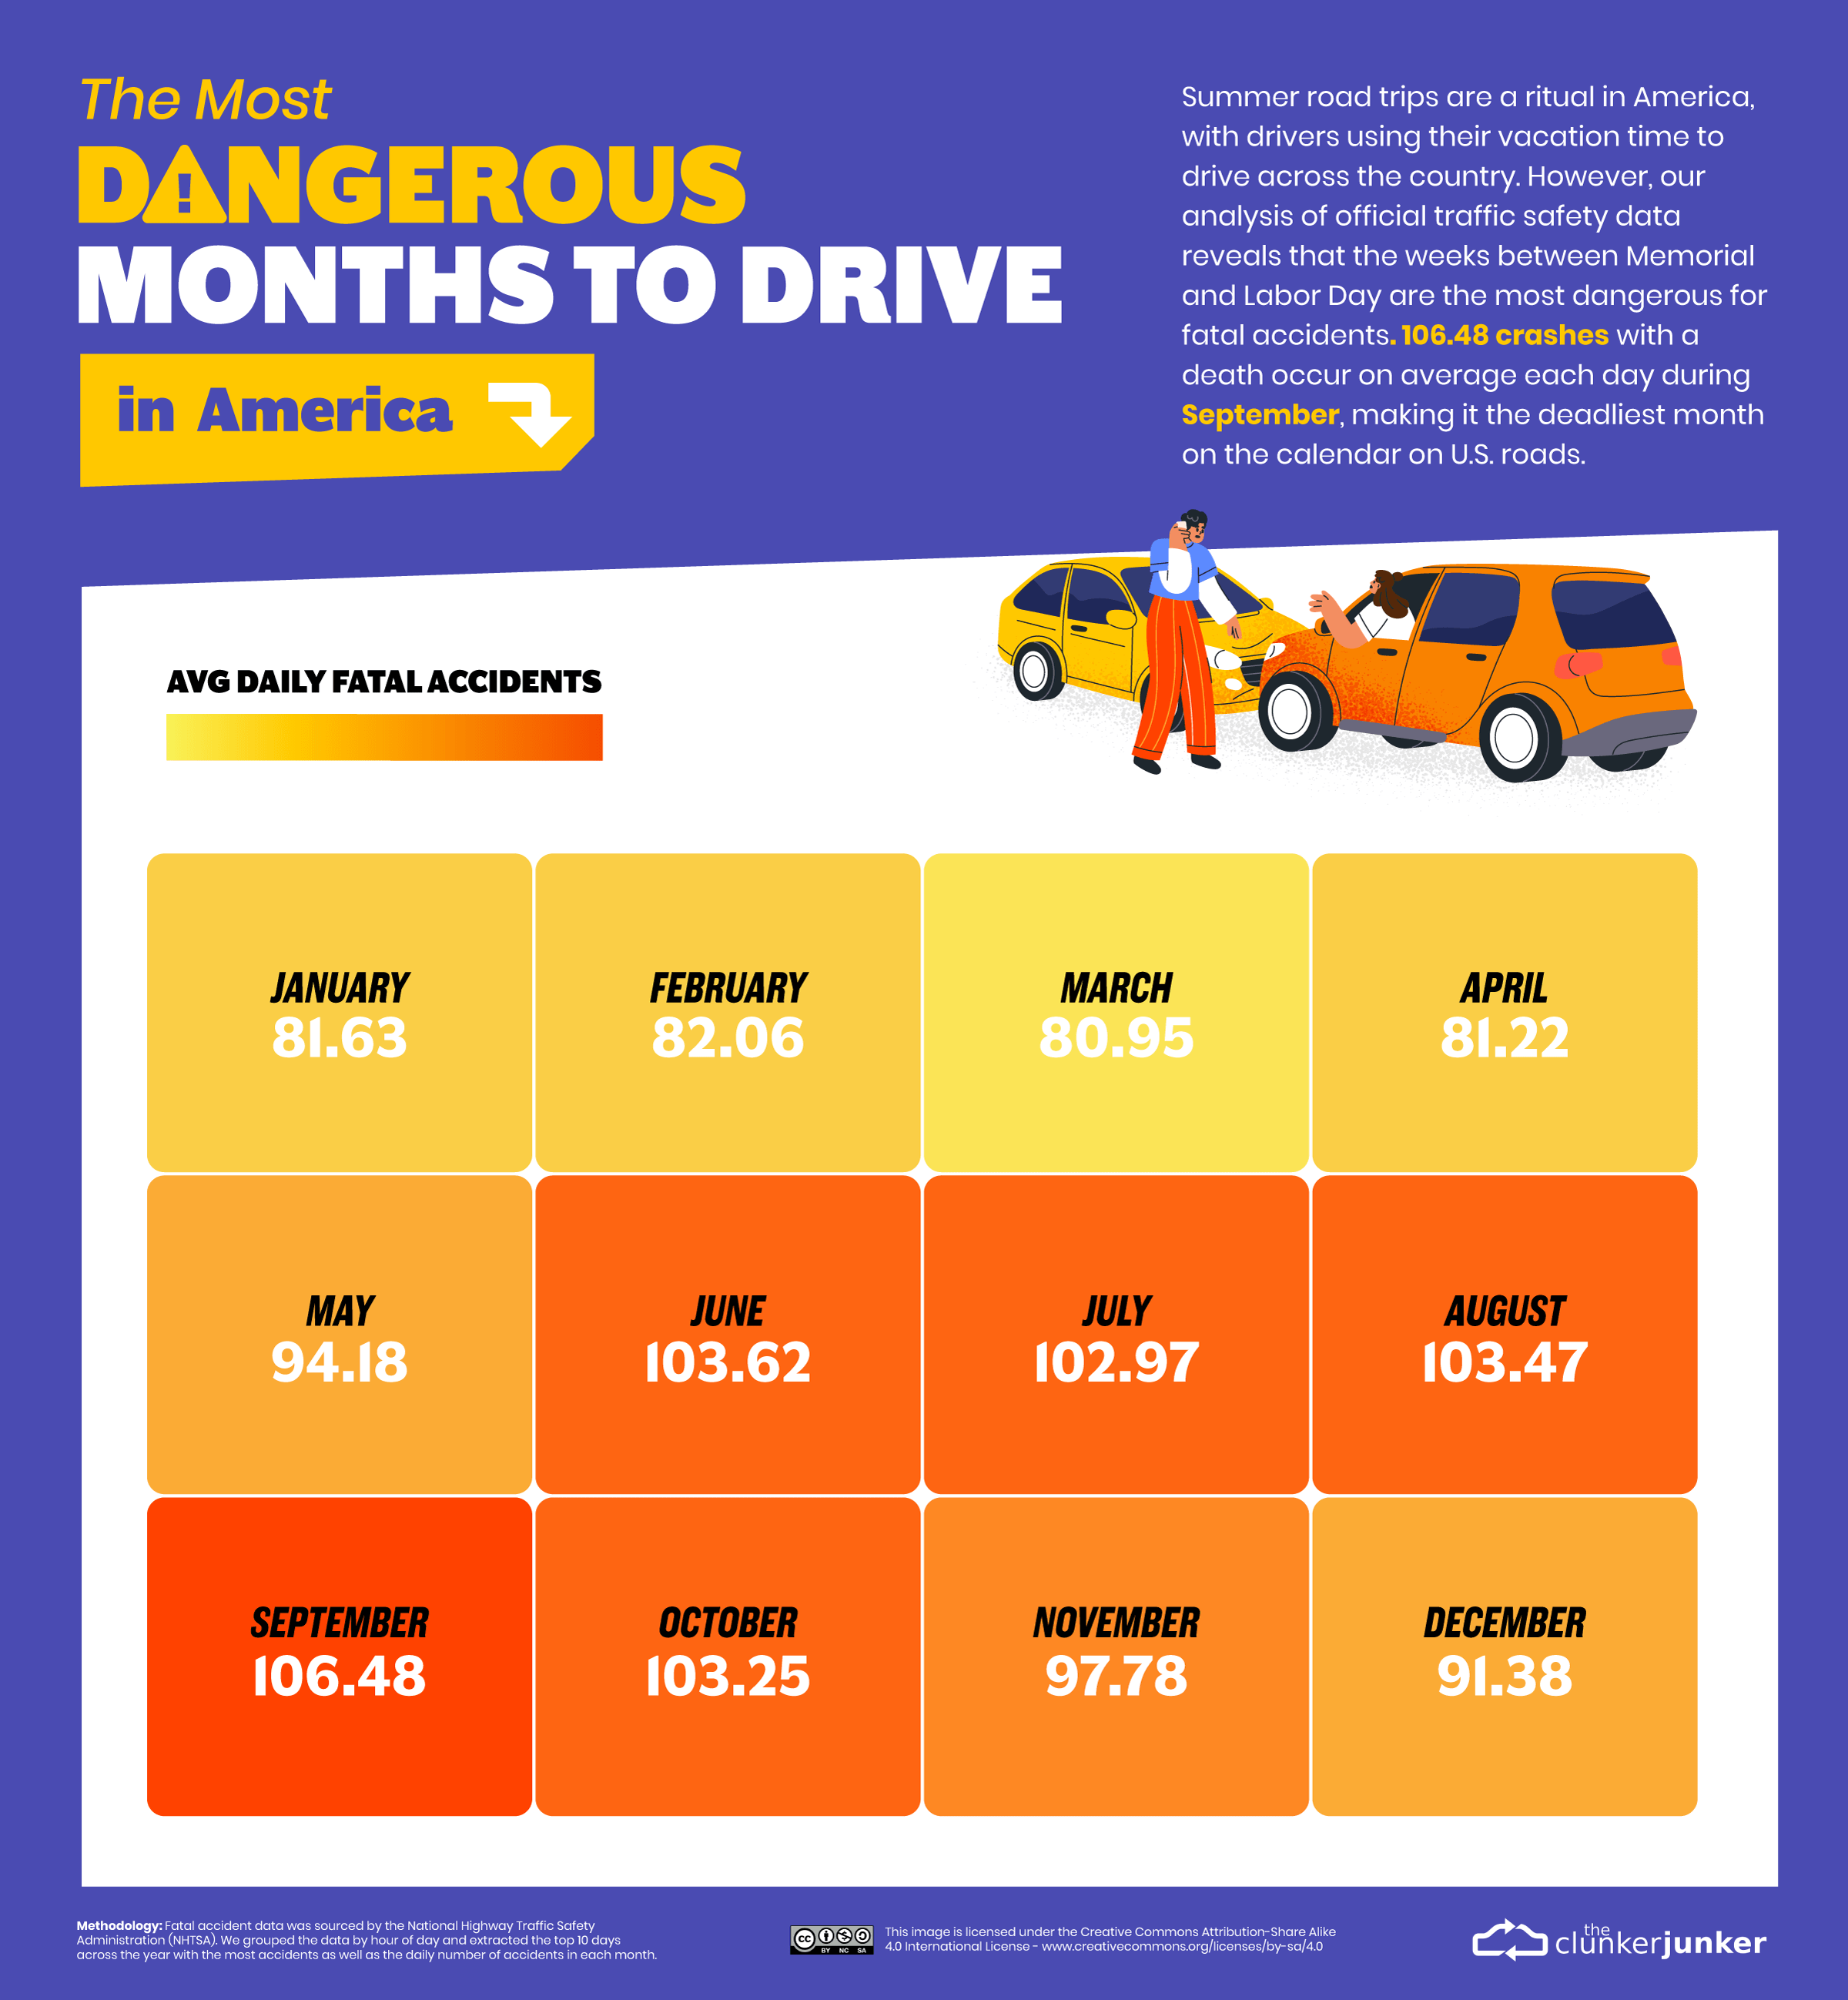
June through August are the peak months of vacation travel in the U.S. and see increased traffic (often on high-speed highways and unfamiliar roads) and fatalities. But September is actually the most dangerous month to drive in America, as the Labor Day weekend and the new school term bring new drivers to the roads.
Other popular U.S. holidays, including the Fourth of July, New Year’s Eve, and Halloween, are also more dangerous than average. In addition to increased instances of drinking and driving, many holidays involve long-distance travel, leading to fatigue.
And finally, according to the NHTSA, the U.S. sees an average of 4.68 fatal accidents on Saturdays making it the most dangerous day. This reaches a peak of over seven fatal accidents between 9 and 10pm every Saturday.

This article was published as a part of Visual Capitalist's Creator Program, which features data-driven visuals from some of our favorite Creators around the world.


Misc
The Top 25 Nationalities of U.S. Immigrants
Mexico is the largest source of immigrants to the U.S., with almost 11 million immigrants.


The Top 25 Nationalities of U.S. Immigrants
This was originally posted on our Voronoi app. Download the app for free on iOS or Android and discover incredible data-driven charts from a variety of trusted sources.
The United States is home to more than 46 million immigrants, constituting approximately 14% of its total population.
This graphic displays the top 25 countries of origin for U.S. immigrants, based on 2022 estimates. The data is sourced from the Migration Policy Institute (MPI), which analyzed information from the U.S. Census Bureau’s 2022 American Community Survey.
In this context, “immigrants” refer to individuals residing in the United States who were not U.S. citizens at birth.
Mexico Emerges as a Leading Source of Immigration
Mexico stands out as the largest contributor to U.S. immigration due to its geographical proximity and historical ties.
Various economic factors, including wage disparities and employment opportunities, motivate many Mexicans to seek better prospects north of the border.
| Country | Region | # of Immigrants |
|---|---|---|
| 🇲🇽 Mexico | Latin America & Caribbean | 10,678,502 |
| 🇮🇳 India | Asia | 2,839,618 |
| 🇨🇳 China | Asia | 2,217,894 |
| 🇵🇭 Philippines | Asia | 1,982,333 |
| 🇸🇻 El Salvador | Latin America & Caribbean | 1,407,622 |
| 🇻🇳 Vietnam | Asia | 1,331,192 |
| 🇨🇺 Cuba | Latin America & Caribbean | 1,312,510 |
| 🇩🇴 Dominican Republic | Latin America & Caribbean | 1,279,900 |
| 🇬🇹 Guatemala | Latin America & Caribbean | 1,148,543 |
| 🇰🇷 Korea | Asia | 1,045,100 |
| 🇨🇴 Colombia | Latin America & Caribbean | 928,053 |
| 🇭🇳 Honduras | Latin America & Caribbean | 843,774 |
| 🇨🇦 Canada | Northern America | 821,322 |
| 🇯🇲 Jamaica | Latin America & Caribbean | 804,775 |
| 🇭🇹 Haiti | Latin America & Caribbean | 730,780 |
| 🇬🇧 United Kingdom | Europe | 676,652 |
| 🇻🇪 Venezuela | Latin America & Caribbean | 667,664 |
| 🇧🇷 Brazil | Latin America & Caribbean | 618,525 |
| 🇩🇪 Germany | Europe | 537,484 |
| 🇪🇨 Ecuador | Latin America & Caribbean | 518,287 |
| 🇵🇪 Peru | Latin America & Caribbean | 471,988 |
| 🇳🇬 Nigeria | Africa | 448,405 |
| 🇺🇦 Ukraine | Europe | 427,163 |
| 🇮🇷 Iran | Middle East | 407,283 |
| 🇵🇰 Pakistan | Asia | 399,086 |
| Rest of World | 11,637,634 | |
| Total | 46,182,089 |
Mexicans are followed in this ranking by Indians, Chinese, and Filipinos, though most immigrants on this list come from countries in the Latin American and Caribbean region.
On the other hand, only three European countries are among the top sources of U.S. immigrants: the UK, Germany, and Ukraine.
Immigration continues to be a significant factor contributing to the overall growth of the U.S. population. Overall population growth has decelerated over the past decade primarily due to declining birth rates.
Between 2021 and 2022, the increase in the immigrant population accounted for 65% of the total population growth in the U.S., representing 912,000 individuals out of nearly 1.4 million.
If you enjoyed this post, be sure to check out Visualized: Why Do People Immigrate to the U.S.? This visualization shows the different reasons cited by new arrivals to America in 2021.

-

 United States1 week ago
Mapped: Countries Where Recreational Cannabis is Legal
-

 Healthcare2 weeks ago
Life Expectancy by Region (1950-2050F)
-

 Markets2 weeks ago
The Growth of a $1,000 Equity Investment, by Stock Market
-

 Markets2 weeks ago
Mapped: Europe’s GDP Per Capita, by Country
-

 Money2 weeks ago
Charted: What Frustrates Americans About the Tax System
-

 Technology2 weeks ago
Countries With the Highest Rates of Crypto Ownership
-

 Mining2 weeks ago
Where the World’s Aluminum is Smelted, by Country
-

 Personal Finance2 weeks ago
Visualizing the Tax Burden of Every U.S. State