Economy
Charted: Comparing the GDP of BRICS and the G7 Countries
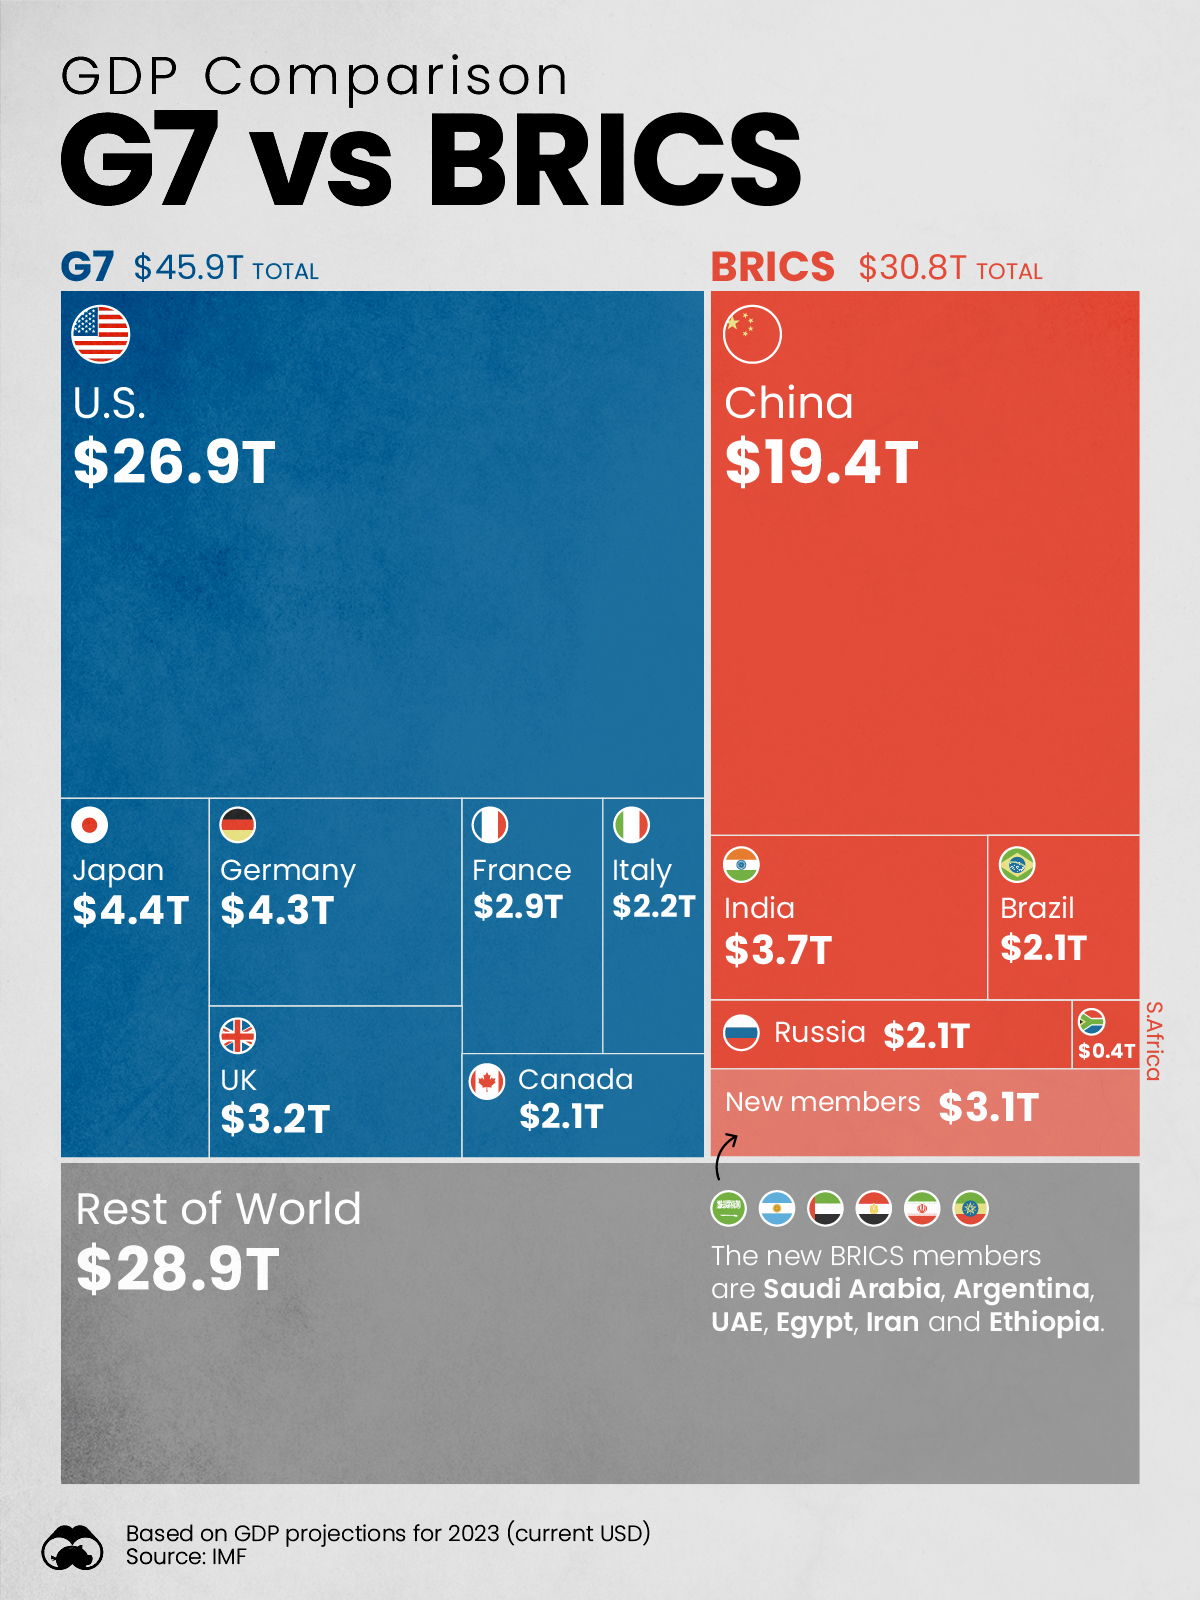
Comparing the GDP of BRICS and the G7: Visualized
BRICS is set to add six new member states at the start of 2024, raising questions about the expansion of the group’s growing economic power. With its new entrants, the bloc will represent over $30 trillion in GDP or around 29% of the world’s GDP.
This graphic compares the GDP of BRICS nations to the G7 by using GDP projections for 2023 from the International Monetary Fund (IMF).
Even with its new members, BRICS falls short of the G7’s 43% share of global GDP. However, the gap is likely to shrink as major BRICS nations such as India continue to grow at above-average rates—and as the group likely welcomes even more members in the future.
How Does BRICS Compare to the G7 with its New Members?
Prior to the addition of its new members (Argentina, Egypt, Ethiopia, Iran, Saudi Arabia, and the UAE), BRICS had a cumulative GDP of $27.7 trillion, a 26% share of global GDP. BRICS’ new members add $3.1 trillion of GDP to the bloc, with Saudi Arabia contributing the most thanks to its GDP of $1.1 trillion.
In the tables below, you can see how new members affect the bloc’s GDP, and how the BRICS compare to G7 countries.
| BRICS Countries | 2023 GDP (USD billions) | Share of Global GDP |
|---|---|---|
| 🇨🇳 China | $19,374 | 18% |
| 🇮🇳 India | $3,737 | 4% |
| 🇧🇷 Brazil | $2,081 | 2% |
| 🇷🇺 Russia | $2,063 | 2% |
| 🇿🇦 South Africa | $399 | 0.4% |
| 🇸🇦 Saudi Arabia* | $1,062 | 1% |
| 🇦🇷 Argentina* | $641 | 0.6% |
| 🇦🇪 UAE* | $499 | 0.5% |
| 🇪🇬 Egypt* | $387 | 0.4% |
| 🇮🇷 Iran* | $368 | 0.4% |
| 🇪🇹 Ethiopia* | $156 | 0.2% |
| BRICS Total | $30,767 | 29% |
*New additions to BRICS that will join bloc on January 2024
Source: IMF
| G7 Countries | 2023 GDP (USD billions) | Share of Global GDP |
|---|---|---|
| 🇺🇸 U.S. | $26,855 | 25% |
| 🇯🇵 Japan | $4,410 | 4% |
| 🇩🇪 Germany | $4,309 | 4% |
| 🇬🇧 UK | $3,159 | 3% |
| 🇫🇷 France | $2,923 | 3% |
| 🇮🇹 Italy | $2,170 | 2% |
| 🇨🇦 Canada | $2,090 | 2% |
| G7 Total | $45,916 | 43% |
Source: IMF
Even with its new members, BRICS still falls short of the G7’s $45.9 trillion in GDP, however, the new members do add other contributions besides raw GDP to the bloc.
With the addition of Saudi Arabia, the UAE, and Iran, BRICS more than doubles its members’ share of global oil production to 43%. Along with petroleum, Argentina’s addition to BRICS significantly expands the total lithium reserves of the group, which will be key as global battery production and EV adoption continue to grow.
As BRICS seems set to create an alternate trade and financial system that operates independently from the U.S. dollar, adding nations with more natural resources is essential.
Future Economic Growth of BRICS vs. G7 Nations
While the new BRICS members don’t have too big of a GDP contribution to the bloc currently, it’s worth noting that many of the new entrants have significant growth ahead of them.
Many of BRICS’ current members already have real GDP growth rates that are higher than their G7 counterparts, with current members having an average GDP growth of 189% to 2050 compared to the G7’s average of 50%, according to Goldman Sachs.
BRICS’ newly added members like Ethiopia (1,170% GDP growth projected by 2050) and Egypt (635% GDP growth projected by 2050) have even higher rates of potential economic growth, further raising the bloc’s economic potential.
Goldman Sachs forecasts indicate that by 2050, BRICS will have overtaken the G7 in terms of GDP, even without its newly added members. Whether or not these projections pan out is yet to be determined, however with BRICS intent on adding even more members, the group is likely to eclipse the G7’s GDP in the coming decades.


Misc
The Top 25 Nationalities of U.S. Immigrants
Mexico is the largest source of immigrants to the U.S., with almost 11 million immigrants.


The Top 25 Nationalities of U.S. Immigrants
This was originally posted on our Voronoi app. Download the app for free on iOS or Android and discover incredible data-driven charts from a variety of trusted sources.
The United States is home to more than 46 million immigrants, constituting approximately 14% of its total population.
This graphic displays the top 25 countries of origin for U.S. immigrants, based on 2022 estimates. The data is sourced from the Migration Policy Institute (MPI), which analyzed information from the U.S. Census Bureau’s 2022 American Community Survey.
In this context, “immigrants” refer to individuals residing in the United States who were not U.S. citizens at birth.
Mexico Emerges as a Leading Source of Immigration
Mexico stands out as the largest contributor to U.S. immigration due to its geographical proximity and historical ties.
Various economic factors, including wage disparities and employment opportunities, motivate many Mexicans to seek better prospects north of the border.
| Country | Region | # of Immigrants |
|---|---|---|
| 🇲🇽 Mexico | Latin America & Caribbean | 10,678,502 |
| 🇮🇳 India | Asia | 2,839,618 |
| 🇨🇳 China | Asia | 2,217,894 |
| 🇵🇭 Philippines | Asia | 1,982,333 |
| 🇸🇻 El Salvador | Latin America & Caribbean | 1,407,622 |
| 🇻🇳 Vietnam | Asia | 1,331,192 |
| 🇨🇺 Cuba | Latin America & Caribbean | 1,312,510 |
| 🇩🇴 Dominican Republic | Latin America & Caribbean | 1,279,900 |
| 🇬🇹 Guatemala | Latin America & Caribbean | 1,148,543 |
| 🇰🇷 Korea | Asia | 1,045,100 |
| 🇨🇴 Colombia | Latin America & Caribbean | 928,053 |
| 🇭🇳 Honduras | Latin America & Caribbean | 843,774 |
| 🇨🇦 Canada | Northern America | 821,322 |
| 🇯🇲 Jamaica | Latin America & Caribbean | 804,775 |
| 🇭🇹 Haiti | Latin America & Caribbean | 730,780 |
| 🇬🇧 United Kingdom | Europe | 676,652 |
| 🇻🇪 Venezuela | Latin America & Caribbean | 667,664 |
| 🇧🇷 Brazil | Latin America & Caribbean | 618,525 |
| 🇩🇪 Germany | Europe | 537,484 |
| 🇪🇨 Ecuador | Latin America & Caribbean | 518,287 |
| 🇵🇪 Peru | Latin America & Caribbean | 471,988 |
| 🇳🇬 Nigeria | Africa | 448,405 |
| 🇺🇦 Ukraine | Europe | 427,163 |
| 🇮🇷 Iran | Middle East | 407,283 |
| 🇵🇰 Pakistan | Asia | 399,086 |
| Rest of World | 11,637,634 | |
| Total | 46,182,089 |
Mexicans are followed in this ranking by Indians, Chinese, and Filipinos, though most immigrants on this list come from countries in the Latin American and Caribbean region.
On the other hand, only three European countries are among the top sources of U.S. immigrants: the UK, Germany, and Ukraine.
Immigration continues to be a significant factor contributing to the overall growth of the U.S. population. Overall population growth has decelerated over the past decade primarily due to declining birth rates.
Between 2021 and 2022, the increase in the immigrant population accounted for 65% of the total population growth in the U.S., representing 912,000 individuals out of nearly 1.4 million.
If you enjoyed this post, be sure to check out Visualized: Why Do People Immigrate to the U.S.? This visualization shows the different reasons cited by new arrivals to America in 2021.

-

 Personal Finance1 week ago
Visualizing the Tax Burden of Every U.S. State
-

 Misc6 days ago
Visualized: Aircraft Carriers by Country
-

 Culture6 days ago
How Popular Snack Brand Logos Have Changed
-

 Mining1 week ago
Visualizing Copper Production by Country in 2023
-

 Misc1 week ago
Charted: How Americans Feel About Federal Government Agencies
-

 Healthcare1 week ago
Which Countries Have the Highest Infant Mortality Rates?
-

 Demographics1 week ago
Mapped: U.S. Immigrants by Region
-

 Maps1 week ago
Mapped: Southeast Asia’s GDP Per Capita, by Country