Markets
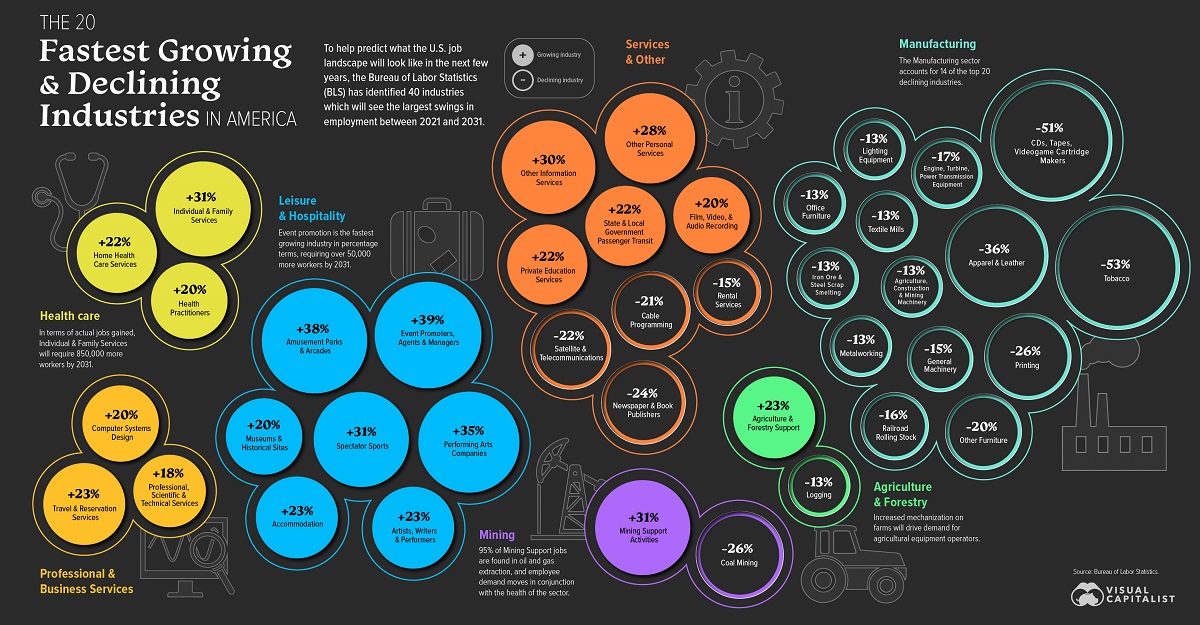
The Fastest Growing and Declining Industries in the U.S. (2021-2031P)
Click to view this graphic in a higher-resolution.


U.S. Employment Trends by Industry (2021–2031)
The labor force is always shifting, responding to technological or societal changes.
For that reason, keeping an eye on the fastest growing industries can help workers and businesses stay on top of the crucial trends driving employment.
Today, we look through projections from the U.S. Bureau of Labor Statistics (BLS) on the fastest growing industries, as well as those that are the fastest declining, by percentage employment change between 2021 and 2031.
Ranked: Fastest Growing Industries By Employment Change
Event Promoters, Agents, and Managers top the list of fastest growing industries, with an impressive predicted growth of 39%, employing over 180,000 workers by 2031.
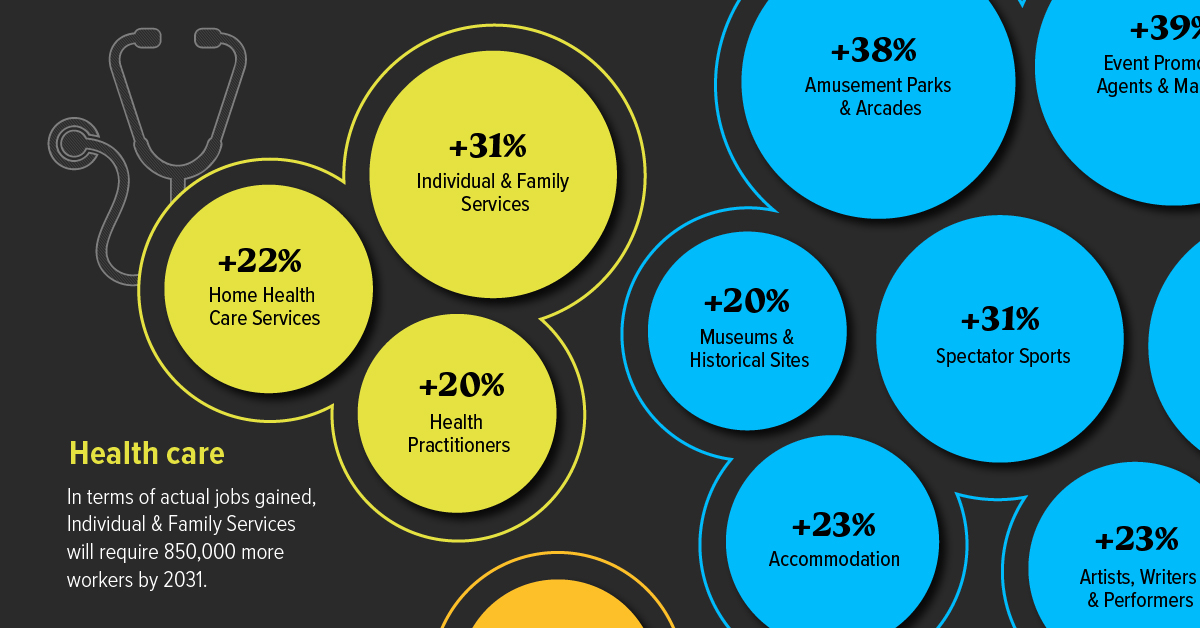
Amusement Parks and Arcades follows close behind, with an expected 38% increase—adding over 60,000 new employees—in the same time period. Ranked third, the Performing Arts industry will start the next decade with around a 100,000-strong workforce, up 35% from 2021.
Below is the full list of BLS’ projected fastest growing industries, ranked by percent change in employment, between 2021–2031.
| Rank | Industry | Sector | Change (2021-2031) | % Change (2021-2031) |
|---|---|---|---|---|
| 1 | Event Promoters, Agents & Managers | Leisure & Hospitality | 50,800 | +39% |
| 2 | Amusement Parks & Arcades | Leisure & Hospitality | 60,500 | +38% |
| 3 | Performing Arts Companies | Leisure & Hospitality | 28,400 | +35% |
| 4 | Individual & Family services | Health Care | 850,000 | +31% |
| 5 | Mining Support Activities | Mining | 69,700 | +31% |
| 6 | Spectator Sports | Leisure & Hospitality | 36,500 | +31% |
| 7 | Other Information Services | Services & Other | 112,900 | +30% |
| 8 | Other Personal Services | Services & Other | 87,200 | +28% |
| 9 | Travel & Reservation Services | Professional & Business Services | 32,300 | +23% |
| 10 | Agriculture & Forestry Support | Agriculture & Forestry | 26,200 | +23% |
| 11 | Artists, Writers & Performers | Leisure & Hospitality | 11,500 | +23% |
| 12 | Accommodation | Leisure & Hospitality | 333,700 | +23% |
| 13 | Private Education Services | Services & Other | 169,200 | +22% |
| 14 | Government Transit | Services & Other | 61,200 | +22% |
| 15 | Home Health Care Services | Health Care | 330,100 | +22% |
| 16 | Health Practitioners | Health Care | 205,500 | +20% |
| 17 | Film, Video, & Audio Recording | Services & Other | 75,300 | +20% |
| 18 | Museums & Historical Sites | Leisure & Hospitality | 27,600 | +20% |
| 19 | Computer Systems Design | Professional & Business Services | 455,200 | +20% |
| 20 | Professional, Scientific & Technical Services | Professional & Business Services | 144,100 | +18% |
Note: Services & Other sector includes Information, Education and State & Local Government industries.
All of the top three industries belong to the Leisure and Hospitality sector, which accounts for seven of the 20 fastest growing industries. This outsized performance reflects recovery more than pure growth, as the BLS notes that the Leisure and Hospitality sector was unduly affected by the COVID-19 pandemic, giving it a lower-than-usual baseline in 2021.
Ranked fourth by employment change percentage is Individual and Family Services, though it is actually expected to see the largest growth in total employment terms, adding 850,000 new workers by the end of the decade. It is one of three industries in the Health Care and Social Assistance sector with large projected growth, thanks to an increased need for care service due to an aging American population.
Not to be missed is Computer Systems Design, projected to grow by 20% in employment thanks to growing demand for computing infrastructure and IT security. Due the industry’s sheer size in employment force with 2.3 million workers in 2021, that’s close to half a million additional workers over the next decade.
Ranked: Fastest Declining Industries By Employment Change
Tobacco Manufacturing leads the group of industries expected to register employment declines by 2031, with a projected decrease of 53% in employment, bringing its already small workforce down to only 5,000 employees by the end of the decade. This stark decline is not necessarily driven by waning smoking habits, as cigarette sales in the U.S. went up during the pandemic. Instead, further automation of the industry may replace tobacco manufacturing employees.
Another industry facing a similar situation is CDs & Tapes Manufacturing, which is expected to witness a 51% reduction in employees by 2031.
Below is the full list of BLS’ projected fastest declining industries, ranked by percent change in employment, between 2021–2031.
| Rank | Industry | Sector | Change (2021-31) | % Change (2021-2031) |
|---|---|---|---|---|
| 1 | Tobacco Manufacturing | Manufacturing | -5,700 | -53% |
| 2 | CDs & Tapes Manufacturing | Manufacturing | -5,800 | -51% |
| 3 | Apparel & Leather Manufacturing | Manufacturing | -41,800 | -36% |
| 4 | Printing | Manufacturing | -96,800 | -26% |
| 5 | Coal Mining | Mining | -9,500 | -26% |
| 6 | Newspaper & Book Publishers | Services & Other | -60,000 | -24% |
| 7 | Satellite & Telecommunications | Services & Other | -19,300 | -22% |
| 8 | Cable Programming | Services & Other | -9,700 | -21% |
| 9 | Other Furniture Manufacturing | Manufacturing | -7,600 | -20% |
| 10 | Engine & Power Transmission Equipment Manufacturing | Manufacturing | -14,800 | -17% |
| 11 | Railroad Rolling Stock Manufacturing | Manufacturing | -3,100 | -16% |
| 12 | Rental Services | Services & Other | -22,200 | -15% |
| 13 | General Machinery Manufacturing | Manufacturing | -39,800 | -15% |
| 14 | Iron Ore & Steel Scrap Smelting | Manufacturing | -10,600 | -13% |
| 15 | Lighting Equipment Manufacturing | Manufacturing | -5,600 | -13% |
| 16 | Metalworking Manufacturing | Manufacturing | -21,100 | -13% |
| 17 | Logging | Agriculture & Forestry | -6,000 | -13% |
| 18 | Textile Mills | Manufacturing | -26,100 | -13% |
| 19 | Agriculture, Construction & Mining Machinery Manufacturing | Manufacturing | -25,500 | -13% |
| 20 | Office Furniture Manufacturing | Manufacturing | -12,600 | -13% |
Most of the industries facing large total employment contraction belong to the Manufacturing sector. The troubles of American manufacturing aren’t new, but the variety of industries presented suggests a mix of factors causing slumps across the sector.
Some industries like Printing, Cable Programming, and Newspaper and Book Publishers face shifting consumption habits.
Meanwhile, others like Textiles, Apparel, and Furniture Manufacturing are expected to suffer from further automation and shifted production abroad.
Factors Shaping Future Employment Trends in the U.S.
It’s important to note that these projections by the BLS were released in September 2022. That means they do not reflect the rapid rise of generative AI like ChatGPT and how they have begun to affect the economy.
A recent Goldman Sachs report, for example, stated that AI could replace 300 million jobs—almost the size of the U.S. population—around the world in the next 10 years.
That makes it an open and important question as to whether AI or powerful demographic trends, such as slower population growth and an aging workforce, will be the most impactful in terms of determining the future employment landscape.


Maps
Mapped: The 10 U.S. States With the Lowest Real GDP Growth
In this graphic, we show where real GDP lagged the most across America in 2023 as high interest rates weighed on state economies.


The Top 10 U.S. States, by Lowest Real GDP Growth
This was originally posted on our Voronoi app. Download the app for free on iOS or Android and discover incredible data-driven charts from a variety of trusted sources.
While the U.S. economy defied expectations in 2023, posting 2.5% in real GDP growth, several states lagged behind.
Last year, oil-producing states led the pack in terms of real GDP growth across America, while the lowest growth was seen in states that were more sensitive to the impact of high interest rates, particularly due to slowdowns in the manufacturing and finance sectors.
This graphic shows the 10 states with the least robust real GDP growth in 2023, based on data from the Bureau of Economic Analysis.
Weakest State Economies in 2023
Below, we show the states with the slowest economic activity in inflation-adjusted terms, using chained 2017 dollars:
| Rank | State | Real GDP Growth 2023 YoY | Real GDP 2023 |
|---|---|---|---|
| 1 | Delaware | -1.2% | $74B |
| 2 | Wisconsin | +0.2% | $337B |
| 3 | New York | +0.7% | $1.8T |
| 4 | Missississippi | +0.7% | $115B |
| 5 | Georgia | +0.8% | $661B |
| 6 | Minnesota | +1.2% | $384B |
| 7 | New Hampshire | +1.2% | $91B |
| 8 | Ohio | +1.2% | $698B |
| 9 | Iowa | +1.3% | $200B |
| 10 | Illinois | +1.3% | $876B |
| U.S. | +2.5% | $22.4T |
Delaware witnessed the slowest growth in the country, with real GDP growth of -1.2% over the year as a sluggish finance and insurance sector dampened the state’s economy.
Like Delaware, the Midwestern state of Wisconsin also experienced declines across the finance and insurance sector, in addition to steep drops in the agriculture and manufacturing industries.
America’s third-biggest economy, New York, grew just 0.7% in 2023, falling far below the U.S. average. High interest rates took a toll on key sectors, with notable slowdowns in the construction and manufacturing sectors. In addition, falling home prices and a weaker job market contributed to slower economic growth.
Meanwhile, Georgia experienced the fifth-lowest real GDP growth rate. In March 2024, Rivian paused plans to build a $5 billion EV factory in Georgia, which was set to be one of the biggest economic development initiatives in the state in history.
These delays are likely to exacerbate setbacks for the state, however, both Kia and Hyundai have made significant investments in the EV industry, which could help boost Georgia’s manufacturing sector looking ahead.

-

 Mining1 week ago
Where the World’s Aluminum is Smelted, by Country
-

 Culture6 days ago
How Popular Snack Brand Logos Have Changed
-

 Mining7 days ago
Visualizing Copper Production by Country in 2023
-

 Politics1 week ago
Charted: How Americans Feel About Federal Government Agencies
-

 Healthcare1 week ago
Which Countries Have the Highest Infant Mortality Rates?
-

 Demographics1 week ago
Mapped: U.S. Immigrants by Region
-

 Economy1 week ago
Mapped: Southeast Asia’s GDP Per Capita, by Country
-

 Automotive1 week ago
How People Get Around in America, Europe, and Asia