Technology
Ranked: America’s 20 Biggest Tech Layoffs Since 2020
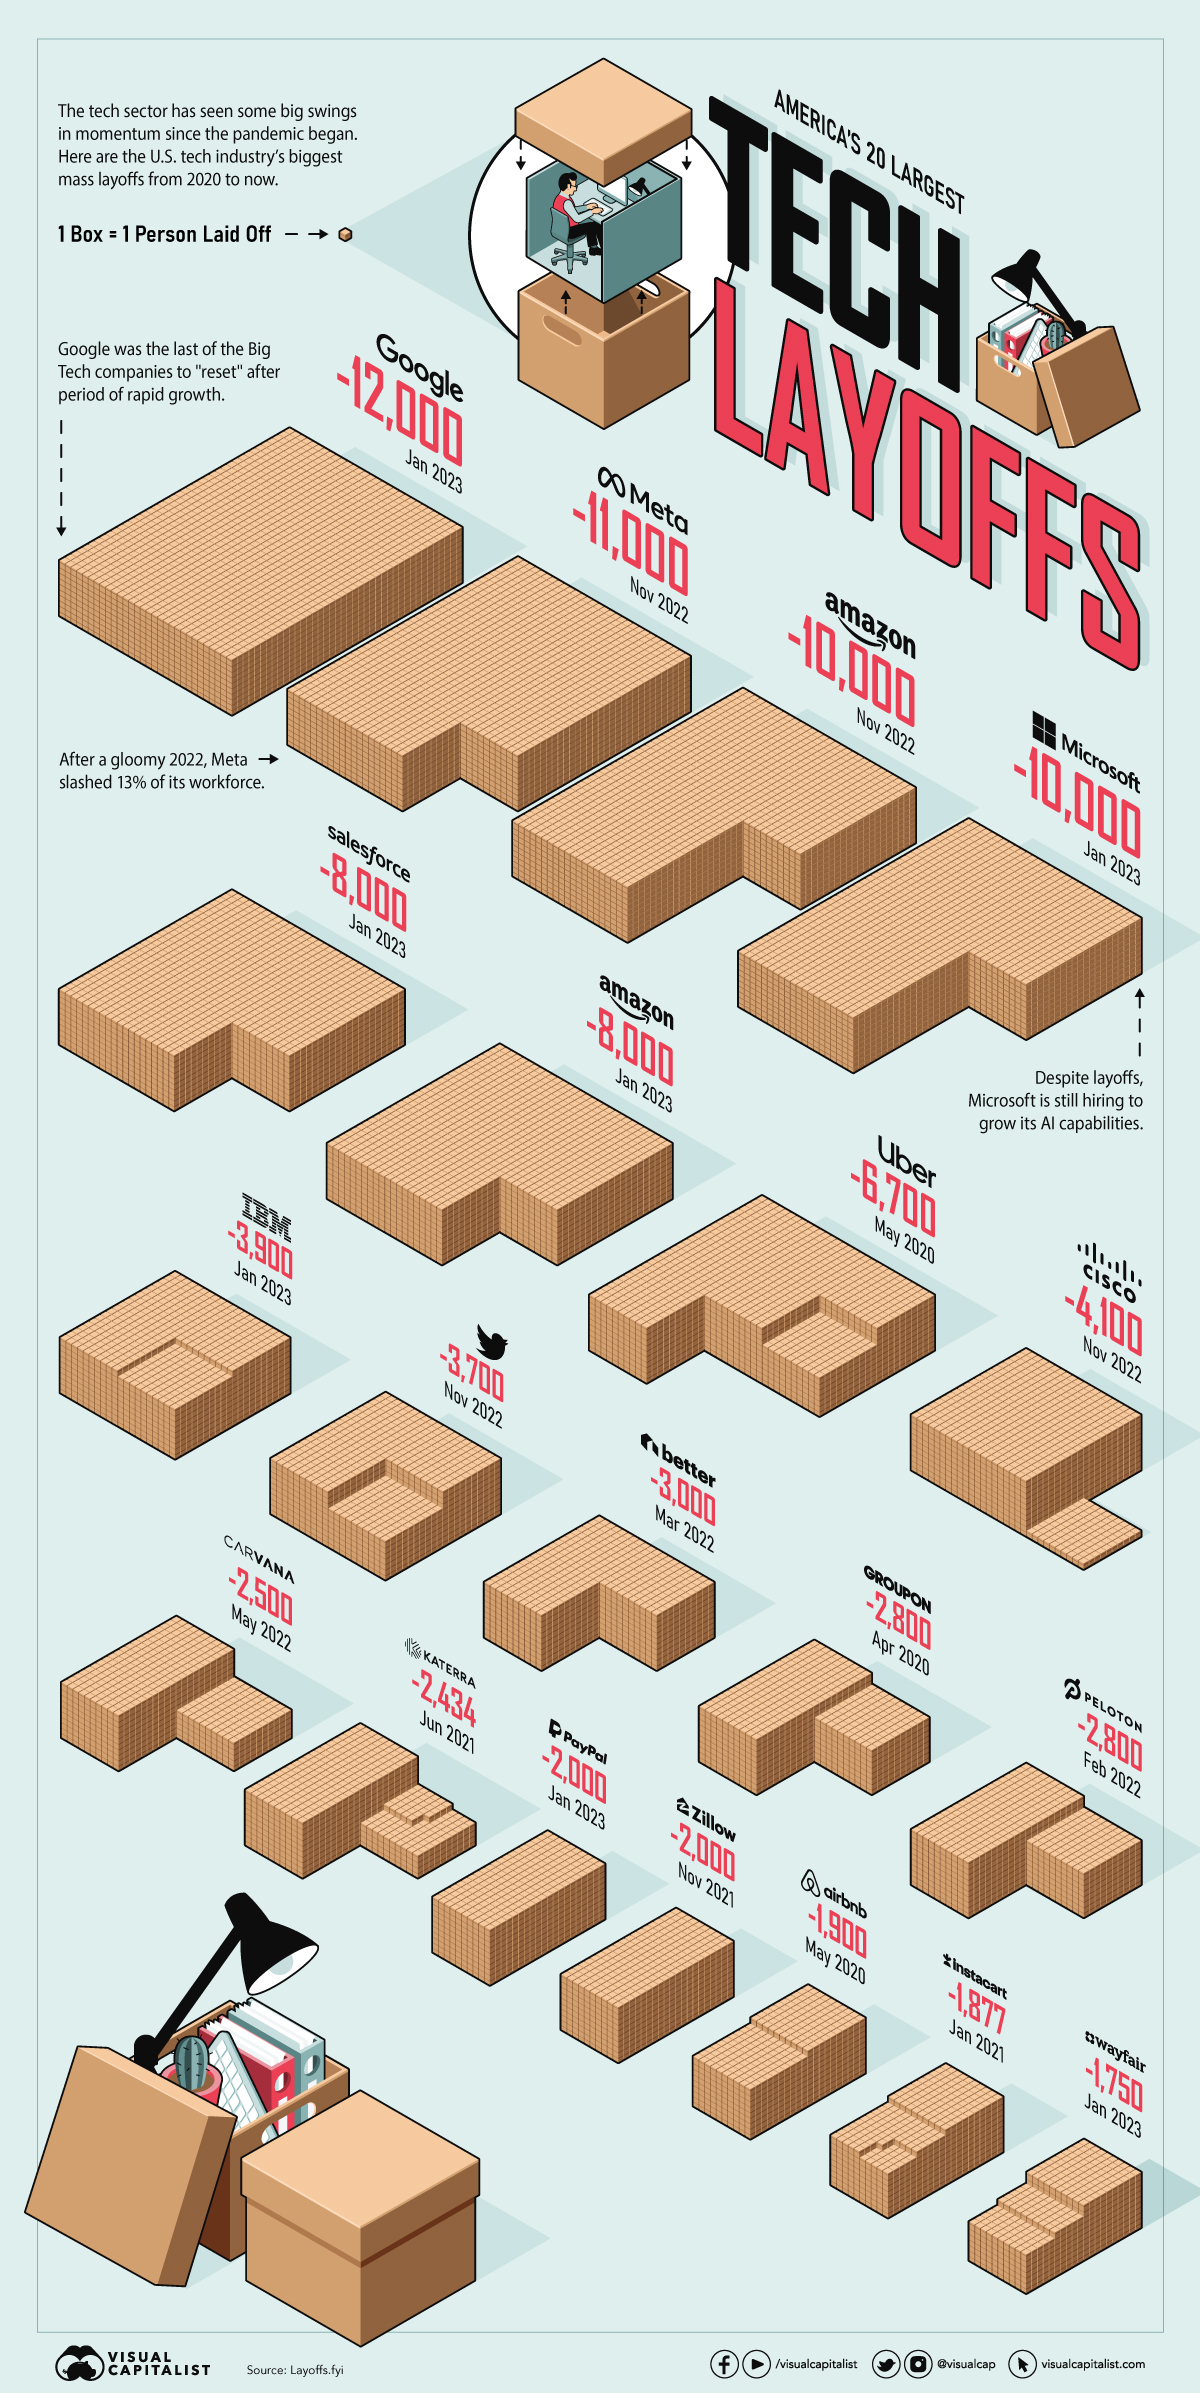


Ranked: America’s 20 Biggest Tech Layoffs This Decade
The events of the last few years could not have been predicted by anyone. From a global pandemic and remote work as the standard, to a subsequent hiring craze, rising inflation, and now, mass layoffs.
Alphabet, Google’s parent company, essentially laid off the equivalent of a small town just weeks ago, letting go of 12,000 people—the biggest layoffs the company has ever seen in its history. Additionally, Amazon and Microsoft have also laid off 10,000 workers each in the last few months, not to mention Meta’s 11,000.
This visual puts the current layoffs in the tech industry in context and ranks the 20 biggest tech layoffs of the 2020s using data from the tracker, Layoffs.fyi.
The Top 20 Layoffs of the 2020s
Since 2020, layoffs in the tech industry have been significant, accelerating in 2022 in particular. Here’s a look at the companies that laid off the most people over the last three years.
| Rank | Company | # Laid Off | % of Workforce | As of |
|---|---|---|---|---|
| #1 | 12,000 | 6% | Jan 2023 | |
| #2 | Meta | 11,000 | 13% | Nov 2021 |
| #3 | Amazon | 10,000 | 3% | Nov 2021 |
| #4 | Microsoft | 10,000 | 5% | Jan 2023 |
| #5 | Salesforce | 8,000 | 10% | Jan 2023 |
| #6 | Amazon | 8,000 | 2% | Jan 2023 |
| #7 | Uber | 6,700 | 24% | May 2020 |
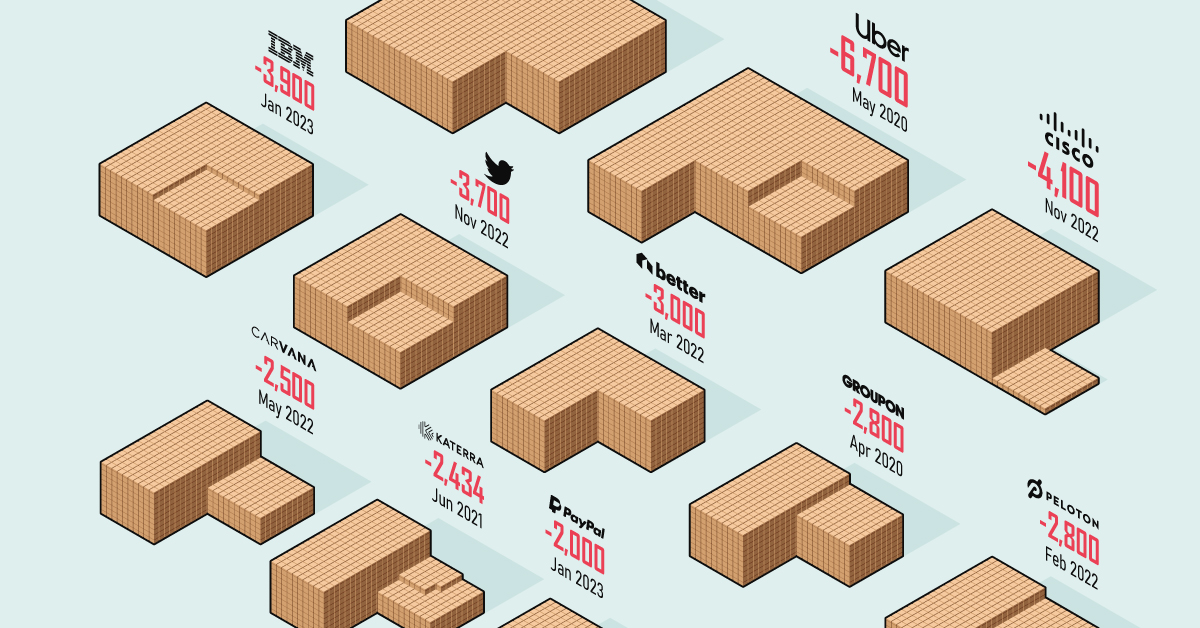
| #8 | Cisco | 4,100 | 5% | Nov 2021 |
| #9 | IBM | 3,900 | 2% | Jan 2023 |
| #10 | 3,700 | 50% | Nov 2022 | |
| #11 | Better.com | 3,000 | 33% | Mar 2022 |
| #12 | Groupon | 2,800 | 44% | Apr 2020 |
| #13 | Peloton | 2,800 | 20% | Feb 2022 |
| #14 | Carvana | 2,500 | 12% | May 2022 |
| #15 | Katerra | 2,434 | 100% | Jun 2021 |
| #16 | Zillow | 2,000 | 25% | Nov 2021 |
| #17 | PayPal | 2,000 | 7% | Jan 2023 |
| #18 | Airbnb | 1,900 | 25% | May 2020 |
| #19 | Instacart | 1,877 | -- | Jan 2021 |
| #20 | Wayfair | 1,750 | 10% | Jan 2023 |
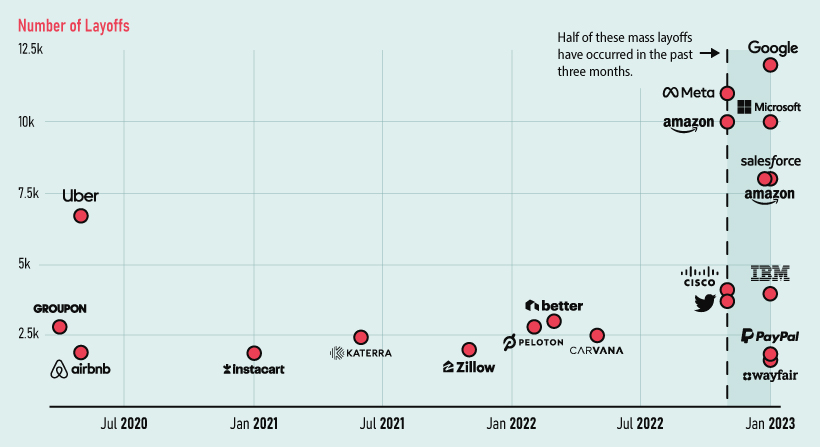
Layoffs were high in 2020 thanks to the COVID-19 pandemic, halting the global economy and forcing staff reductions worldwide. After that, things were steady until the economic uncertainty of last year, which ultimately led to large-scale layoffs in tech—with many of the biggest cuts happening in the past three months.
The Cause of Layoffs
Most workforce slashings are being blamed on the impending recession. Companies are claiming they are forced to cut down the excess of the hiring boom that followed the pandemic.
Additionally, during this hiring craze competition was fierce, resulting in higher salaries for workers, which is now translating in an increased need to trim the fat thanks to the current economic conditions.
Of course, the factors leading up to these recent layoffs are more nuanced than simple over-hiring plus recession narrative. In truth, there appears to be a culture shift occurring at many of America’s tech companies. As Rani Molla and Shirin Ghaffary from Recode have astutely pointed out, tech giants really want you to know they’re behaving like scrappy startups again.
Twitter’s highly publicized headcount reduction in late 2022 occurred for reasons beyond just macroeconomic factors. Elon Musk’s goal of doing more with a smaller team seemed to resonate with other founders and executives in Silicon Valley, providing an opening for others in tech space to cut down on labor costs as well. In just one example, Mark Zuckerberg hailed 2023 as the “year of efficiency” for Meta.
Meanwhile, over at Google, 12,000 jobs were put on the chopping block as the company repositions itself to win the AI race. In the words of Google’s own CEO:
“Over the past two years we’ve seen periods of dramatic growth. To match and fuel that growth, we hired for a different economic reality than the one we face today… We have a substantial opportunity in front of us with AI across our products and are prepared to approach it boldly and responsibly.”– Sundar Pichai
The Bigger Picture in the U.S. Job Market
Beyond the tech sector, job openings continue to rise. Recent data from the Bureau of Labor Statistics (BLS) revealed a total of 11 million job openings across the U.S., an increase of almost 7% month-over-month. This means that for every unemployed worker in America right now there are 1.9 job openings available.
Additionally, hiring increased significantly in January, with employers adding 517,000 jobs. While the BLS did report a decrease in openings in information-based industries, openings are increasing rapidly especially in the food services, retail trade, and construction industries.


Technology
Charting the Next Generation of Internet
In this graphic, Visual Capitalist has partnered with MSCI to explore the potential of satellite internet as the next generation of internet innovation.

Could Tomorrow’s Internet be Streamed from Space?
In 2023, 2.6 billion people could not access the internet. Today, companies worldwide are looking to innovative technology to ensure more people are online at the speed of today’s technology.
Could satellite internet provide the solution?
In collaboration with MSCI, we embarked on a journey to explore whether tomorrow’s internet could be streamed from space.
Satellite Internet’s Potential Customer Base
Millions of people live in rural communities or mobile homes, and many spend much of their lives at sea or have no fixed abode. So, they cannot access the internet simply because the technology is unavailable.
Satellite internet gives these communities access to the internet without requiring a fixed location. Consequently, the volume of people who could get online using satellite internet is significant:
| Area | Potential Subscribers |
|---|---|
| Households Without Internet Access | 600,000,000 |
| RVs | 11,000,000 |
| Recreational Boats | 8,500,000 |
| Ships | 100,000 |
| Commercial Aircraft | 25,000 |
Advances in Satellite Technology
Satellite internet is not a new concept. However, it has only recently been that roadblocks around cost and long turnaround times have been overcome.
NASA’s space shuttle, until it was retired in 2011, was the only reusable means of transporting crew and cargo into orbit. It cost over $1.5 billion and took an average of 252 days to launch and refurbish.
In stark contrast, SpaceX’s Falcon 9 can now launch objects into orbit and maintain them at a fraction of the time and cost, less than 1% of the space shuttle’s cost.
| Average Rocket Turnaround Time | Average Launch/Refurbishment Cost | |
|---|---|---|
| Falcon 9* | 21 days | < $1,000,000 |
| Space Shuttle | 252 days | $1,500,000,000 (approximately) |
Satellites are now deployed 300 miles in low Earth orbit (LEO) rather than 22,000 miles above Earth in Geostationary Orbit (GEO), previously the typical satellite deployment altitude.
What this means for the consumer is that satellite internet streamed from LEO has a latency of 40 ms, which is an optimal internet connection. Especially when compared to the 700 ms stream latency experienced with satellite internet streamed from GEO.
What Would it Take to Build a Satellite Internet?
SpaceX, the private company that operates Starlink, currently has 4,500 satellites. However, the company believes it will require 10 times this number to provide comprehensive satellite internet coverage.
Charting the number of active satellites reveals that, despite the increasing number of active satellites, many more must be launched to create a comprehensive satellite internet.
| Year | Number of Active Satellites |
|---|---|
| 2022 | 6,905 |
| 2021 | 4,800 |
| 2020 | 3,256 |
| 2019 | 2,272 |
| 2018 | 2,027 |
| 2017 | 1,778 |
| 2016 | 1,462 |
| 2015 | 1,364 |
| 2014 | 1,262 |
| 2013 | 1,187 |
Next-Generation Internet Innovation
Innovation is at the heart of the internet’s next generation, and the MSCI Next Generation Innovation Index exposes investors to companies that can take advantage of potentially disruptive technologies like satellite internet.
You can gain exposure to companies advancing access to the internet with four indexes:
- MSCI ACWI IMI Next Generation Internet Innovation Index
- MSCI World IMI Next Generation Internet Innovation 30 Index
- MSCI China All Shares IMI Next Generation Internet Innovation Index
- MSCI China A Onshore IMI Next Generation Internet Innovation Index
MSCI thematic indexes are objective, rules-based, and regularly updated to focus on specific emerging trends that could evolve.
Click here to explore the MSCI thematic indexes

-

 Technology1 week ago
Countries With the Highest Rates of Crypto Ownership
While the U.S. is a major market for cryptocurrencies, two countries surpass it in terms of their rates of crypto ownership.
-

 Technology1 week ago
Mapped: The Number of AI Startups By Country
Over the past decade, thousands of AI startups have been funded worldwide. See which countries are leading the charge in this map graphic.
-

 Technology3 weeks ago
All of the Grants Given by the U.S. CHIPS Act
Intel, TSMC, and more have received billions in subsidies from the U.S. CHIPS Act in 2024.
-

 Technology3 weeks ago
Visualizing AI Patents by Country
See which countries have been granted the most AI patents each year, from 2012 to 2022.
-

 Technology3 weeks ago
How Tech Logos Have Evolved Over Time
From complete overhauls to more subtle tweaks, these tech logos have had quite a journey. Featuring: Google, Apple, and more.
-

 AI1 month ago
Ranked: Semiconductor Companies by Industry Revenue Share
Nvidia is coming for Intel’s crown. Samsung is losing ground. AI is transforming the space. We break down revenue for semiconductor companies.

-

 Markets1 week ago
Mapped: The Most Valuable Company in Each Southeast Asian Country
-

 Personal Finance7 days ago
Visualizing the Tax Burden of Every U.S. State
-

 Mining1 week ago
Where the World’s Aluminum is Smelted, by Country
-
Technology1 week ago
Countries With the Highest Rates of Crypto Ownership
-

 Money1 week ago
Charted: What Frustrates Americans About the Tax System
-

 Economy1 week ago
Mapped: Europe’s GDP Per Capita, by Country
-

 Stocks1 week ago
The Growth of a $1,000 Equity Investment, by Stock Market
-

 Healthcare1 week ago
Life Expectancy by Region (1950-2050F)