Healthcare
The 7 Best COVID-19 Resources We’ve Discovered So Far
With all eyes on the COVID-19 pandemic and how its impact will be felt over the coming weeks and months, people are being bombarded with all kinds of noise and speculation.
Between a deadly virus, looming economic effects, and numerous government shutdowns, it’s clear that a fertile breeding ground has been created for misinformation, rumors, conspiracy theories, hot takes, and other potentially misleading content.
7 Indispensable COVID-19 Resources
At Visual Capitalist, it’s our goal to use data-driven visuals to explain the world around us.
In the last week alone, we’ve had more than 10 million people visit our site — many of them trying to understand more about COVID-19 and its effects on the economy and society.
With that in mind, we thought we’d curate a list of quality information on the virus and its impact. These COVID-19 resources are all from fact-driven, reliable sources, with some of them even being created by our in-house team and shared to our free daily mailing list.
On the below list, we start with the more contextual resources (understanding how the virus works, pandemic history, etc.) and then progress to real-time dashboards and up-to-date data.
Click any image below to see the full resource or dashboard. Many are updated daily or in real-time.
1. How Coronaviruses Work
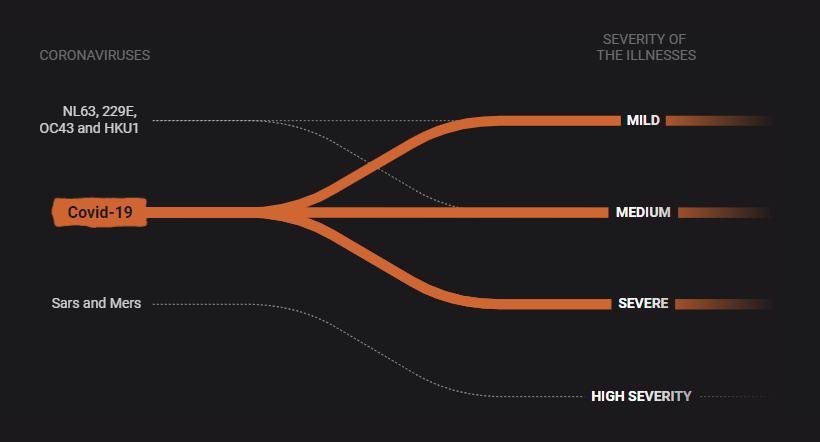
What is a coronavirus, and how does COVID-19 fit into the mix?
This educational scrolling infographic by SCMP walks you through some of the more familiar types of coronaviruses, how they spread, and how they affect the human body.
It also relates COVID-19 to other coronaviruses that cause diseases such as Mers, Sars, and even the common cold.
2. The History of Pandemics
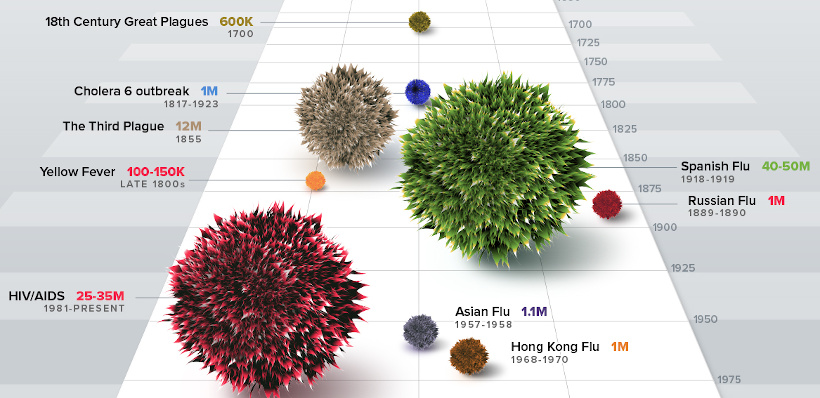
On March 11th, the World Health Organization declared COVID-19 a pandemic.
In this infographic, we look at the data to show you the history of pandemics — all the way from the Black Death to how the current COVID-19 situation. It helps give the historical context on how bad a pandemic can be. It’s also updated every day so you can see how COVID-19 compares to the impact of these previous events.
3. Coronavirus Simulator: Limiting the Exponential Spread
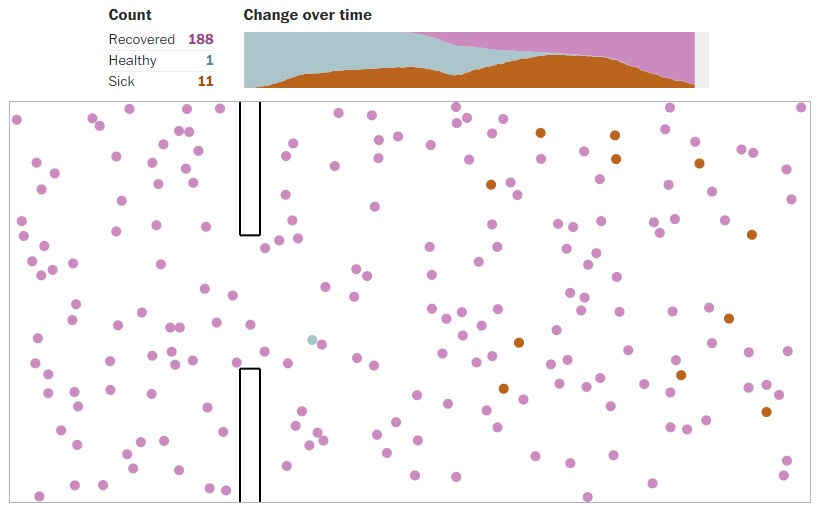
Why does the virus spread at an exponential rate, and what techniques can be used to mitigate that spread?
This fantastic interactive page by the Washington Post actively simulates what happens when the virus spreads normally, contrasting it to how it may spread in a forced quarantine environment or when social distancing is practiced.
4. Real-time COVID-19 Map
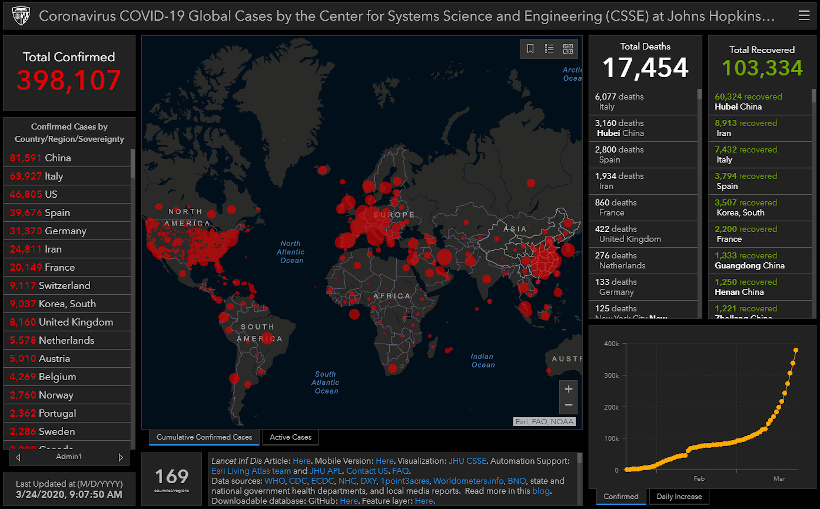
If you haven’t seen this useful real-time dashboard by Johns Hopkins University yet, it’s worth bookmarking right now.
We check the resource every day, and it has the latest numbers for COVID-19 cases, deaths, recoveries, and more — and it’s all sorted by country and/or state and province. Importantly, it also updates in real-time, so you always know you are getting the latest numbers.
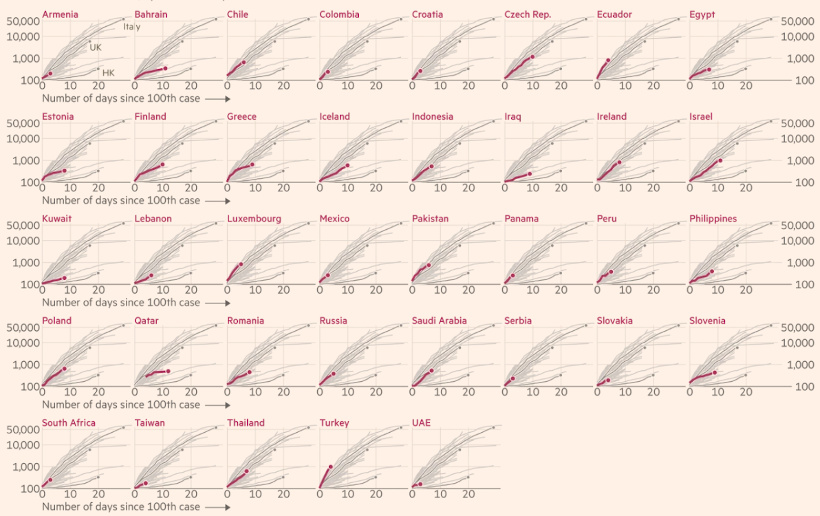
5. Which Countries are “Flattening the Curve”?
Our post on which countries are “flattening the curve” has had over a million views in the last week alone, and it features the above interactive graph from Our World in Data.
Go to the post itself to see a bigger version of the logarithmic chart, which plots the progress of different countries in flattening the curves of COVID-19 infections. The interactive chart updates daily based on the latest numbers, and you can actually search for any country by using the “Search” button. Using the filters on the right side, you can also sort by region as well.
6. Tracking the Coronavirus: The Latest Figures
Even though the Financial Times is a subscription-based website, it recently published this useful COVID-19 dashboard and made it accessible to everyone.
It features various charts and tables on the countries affected, as well as ongoing assessments on the economic damage caused by the virus. Like many of the other COVID-19 resources featured on this list, it is updated on a daily basis.
7. COVID-19 Stats and Research
The above graphic is one of many available on Our World in Data, a fantastic initiative led by economist Max Roser.
Their coronavirus research page has tons of stats, citations, and data for those that want to dive deeper into the situation. It’s also updated very regularly.
Bonus: The Coronavirus Explained, and What You Should Do
While this is less data-driven than the other pieces of content, this animated video by Kurzgesagt still provides a handy explainer on how the virus works.
It’s about eight minutes long, and might help you fill other knowledge gaps.
Please Share These Resources
At a time when misinformation can be dangerous and even deadly, it is worth spreading the above COVID-19 resources to your friends, family, and colleagues.
Many of the above resources are updated daily or they contain evergreen information, meaning they are not going to go out of date any time soon.
Wishing you a safe next few months,
– The Visual Capitalist team
PS: If you have any other great resources to share, please post them in the comments!


United States
Mapped: Countries Where Recreational Cannabis is Legal
In total, only nine countries have fully legalized recreational cannabis use.
Countries Where Recreational Cannabis is Legal
This was originally posted on our Voronoi app. Download the app for free on iOS or Android and discover incredible data-driven charts from a variety of trusted sources.
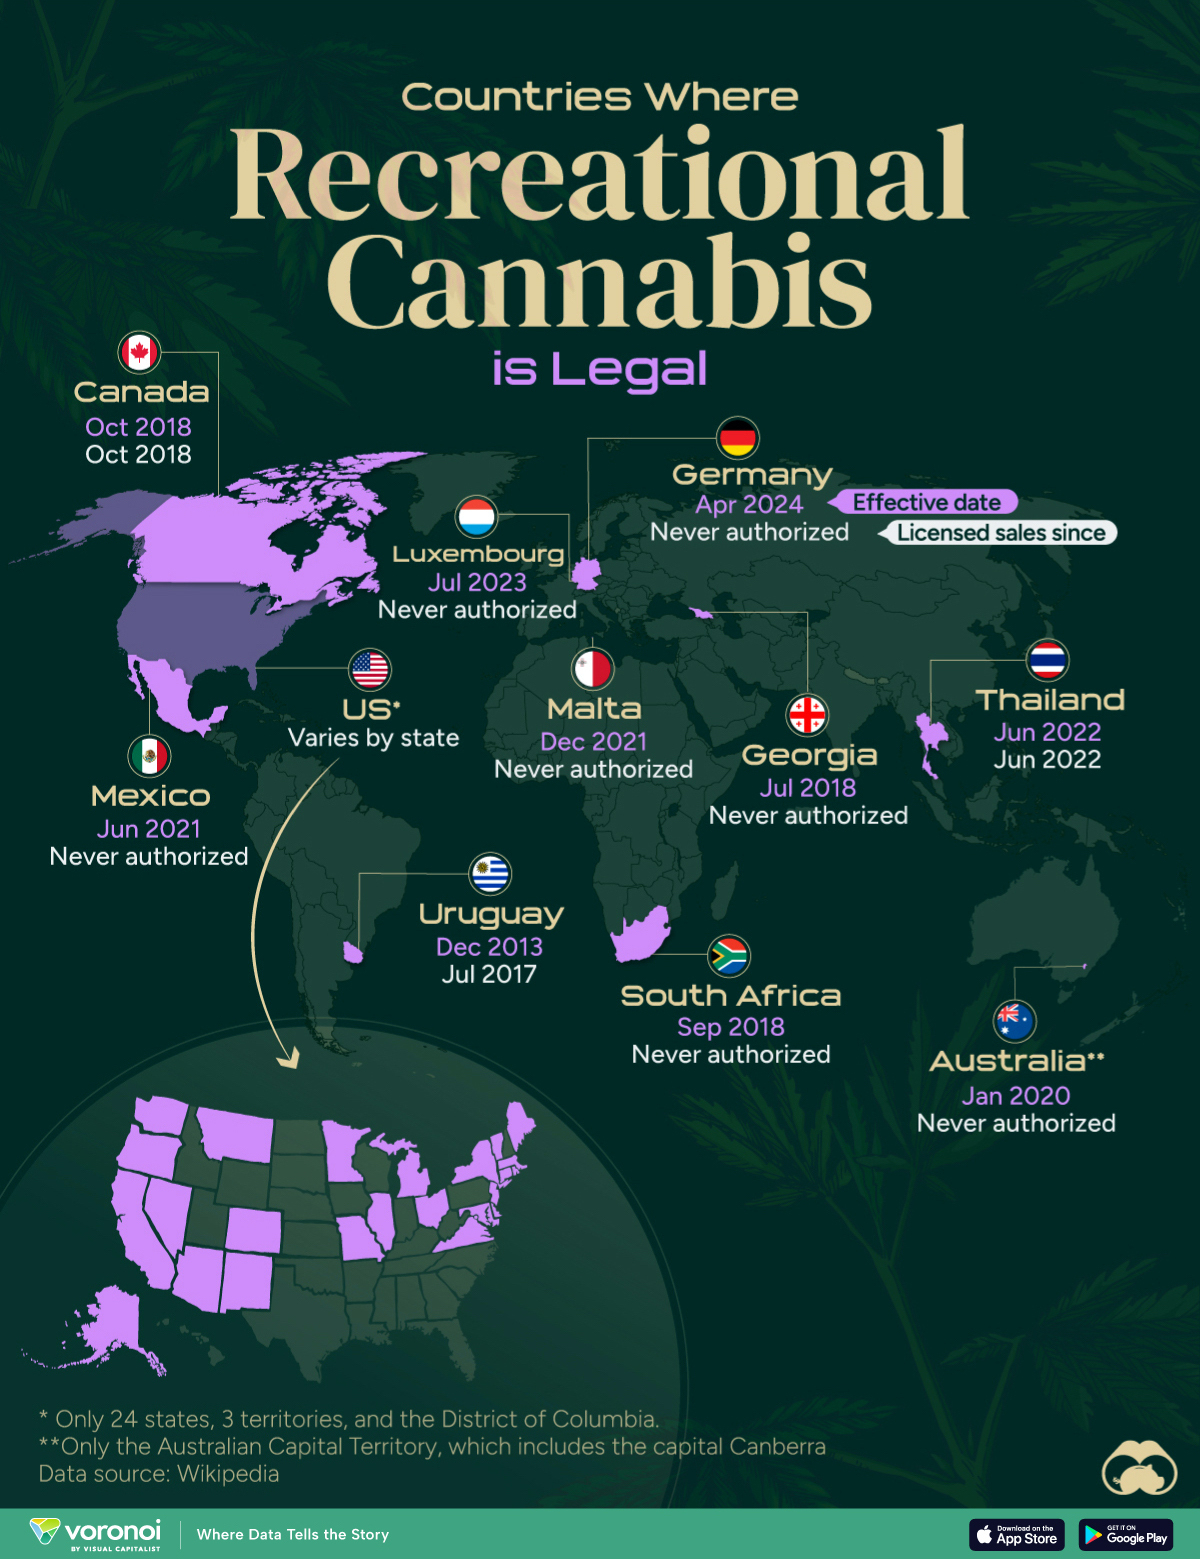
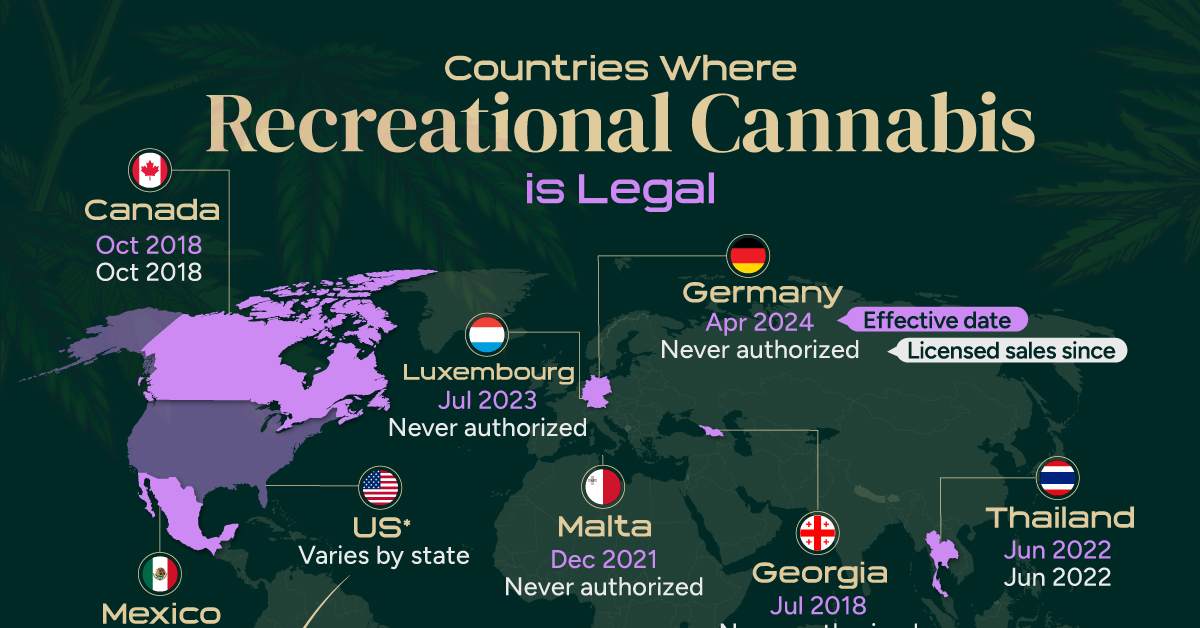
In 2024, Germany became the third European Union country to legalize cannabis for personal use, following Malta and Luxembourg.
Here, we map the countries where recreational cannabis use is allowed as of April 2024, based on data from Wikipedia.
Limited to Few Countries
In total, only nine countries have legalized recreational cannabis use nationwide. However, just a few of them have licensed sales.
| Country | Effective date | Licensed sales since |
|---|---|---|
| 🇺🇾 Uruguay | December 2013 | July 2017 |
| 🇬🇪 Georgia | 30 July 2018 | Never authorized |
| 🇿🇦 South Africa | 18 September 2018 | Never authorized |
| 🇨🇦 Canada | 17 October 2018 | 17 October 2018 |
| 🇲🇽 Mexico | 28 June 2021 | Never authorized |
| 🇲🇹 Malta | 14 December 2021 | Never authorized |
| 🇹🇭 Thailand | 9 June 2022 | 9 June 2022 |
| 🇱🇺 Luxembourg | 21 July 2023 | Never authorized |
| 🇩🇪 Germany | 1 April 2024 | Never authorized |
| 🇺🇸 U.S. | Varies by state | Varies by state |
| 🇦🇺 Australia | Varies by jurisdiction | Never authorized |
At the federal level, cannabis is still considered an illegal substance in the United States. That said, individual states do have the right to determine their laws around cannabis sales and usage. Currently, cannabis is allowed in 24 states, 3 territories, and the District of Columbia.
Interestingly, the oldest legal text concerning cannabis dates back to the 1600s—when the colony of Virginia required every farm to grow and produce hemp.
Since then, cannabis use was fairly widespread until the 1930s when the Marihuana Tax Act was enforced, prohibiting marijuana federally but still technically allowing for medical use.
Today, the U.S. cannabis market is a $30 billion business. By the end of the decade, that number is expected to be anywhere from $58 billion to as much as $72 billion.
Similar to the U.S., Australia does not allow the use at the national level, but cannabis can be used legally in the Australian Capital Territory, which includes the capital Canberra.

-

 Personal Finance1 week ago
Visualizing the Tax Burden of Every U.S. State
-

 Misc6 days ago
Visualized: Aircraft Carriers by Country
-

 Culture6 days ago
How Popular Snack Brand Logos Have Changed
-

 Mining1 week ago
Visualizing Copper Production by Country in 2023
-

 Misc1 week ago
Charted: How Americans Feel About Federal Government Agencies
-

 Healthcare1 week ago
Which Countries Have the Highest Infant Mortality Rates?
-

 Demographics1 week ago
Mapped: U.S. Immigrants by Region
-

 Maps1 week ago
Mapped: Southeast Asia’s GDP Per Capita, by Country