Misc
12 Ways to Get Smarter in One Infographic
View a high resolution version of this graphic
12 Ways to Get Smarter in One Infographic
View the high resolution version of today’s graphic by clicking here.
The level of a person’s raw intelligence, as measured by aptitude tests such as IQ scores, is generally stable for most people during the course of their adulthood.
While it’s true that there are things you can do to fine tune your natural capabilities, such as doing brain exercises, solving puzzles, and getting optimal sleep—the amount of raw brainpower you have is difficult to increase in any meaningful or permanent way.
For those of us who constantly strive to be high-performers in our fields, this seems like bad news. If we can’t increase our processing power, then how can we solve life’s bigger problems as we move up the ladder?
The Key: Mental Models
The good news is that while raw cognitive abilities matter, it’s how you use and harness those abilities that really makes the difference.
The world’s most successful people, from Ray Dalio to Warren Buffett, are not necessarily leagues above the rest of us in raw intelligence—instead, they simply develop and learn to apply better mental models of how the world works, and they use these principles to filter their thoughts, decisions, strategies, and execution.
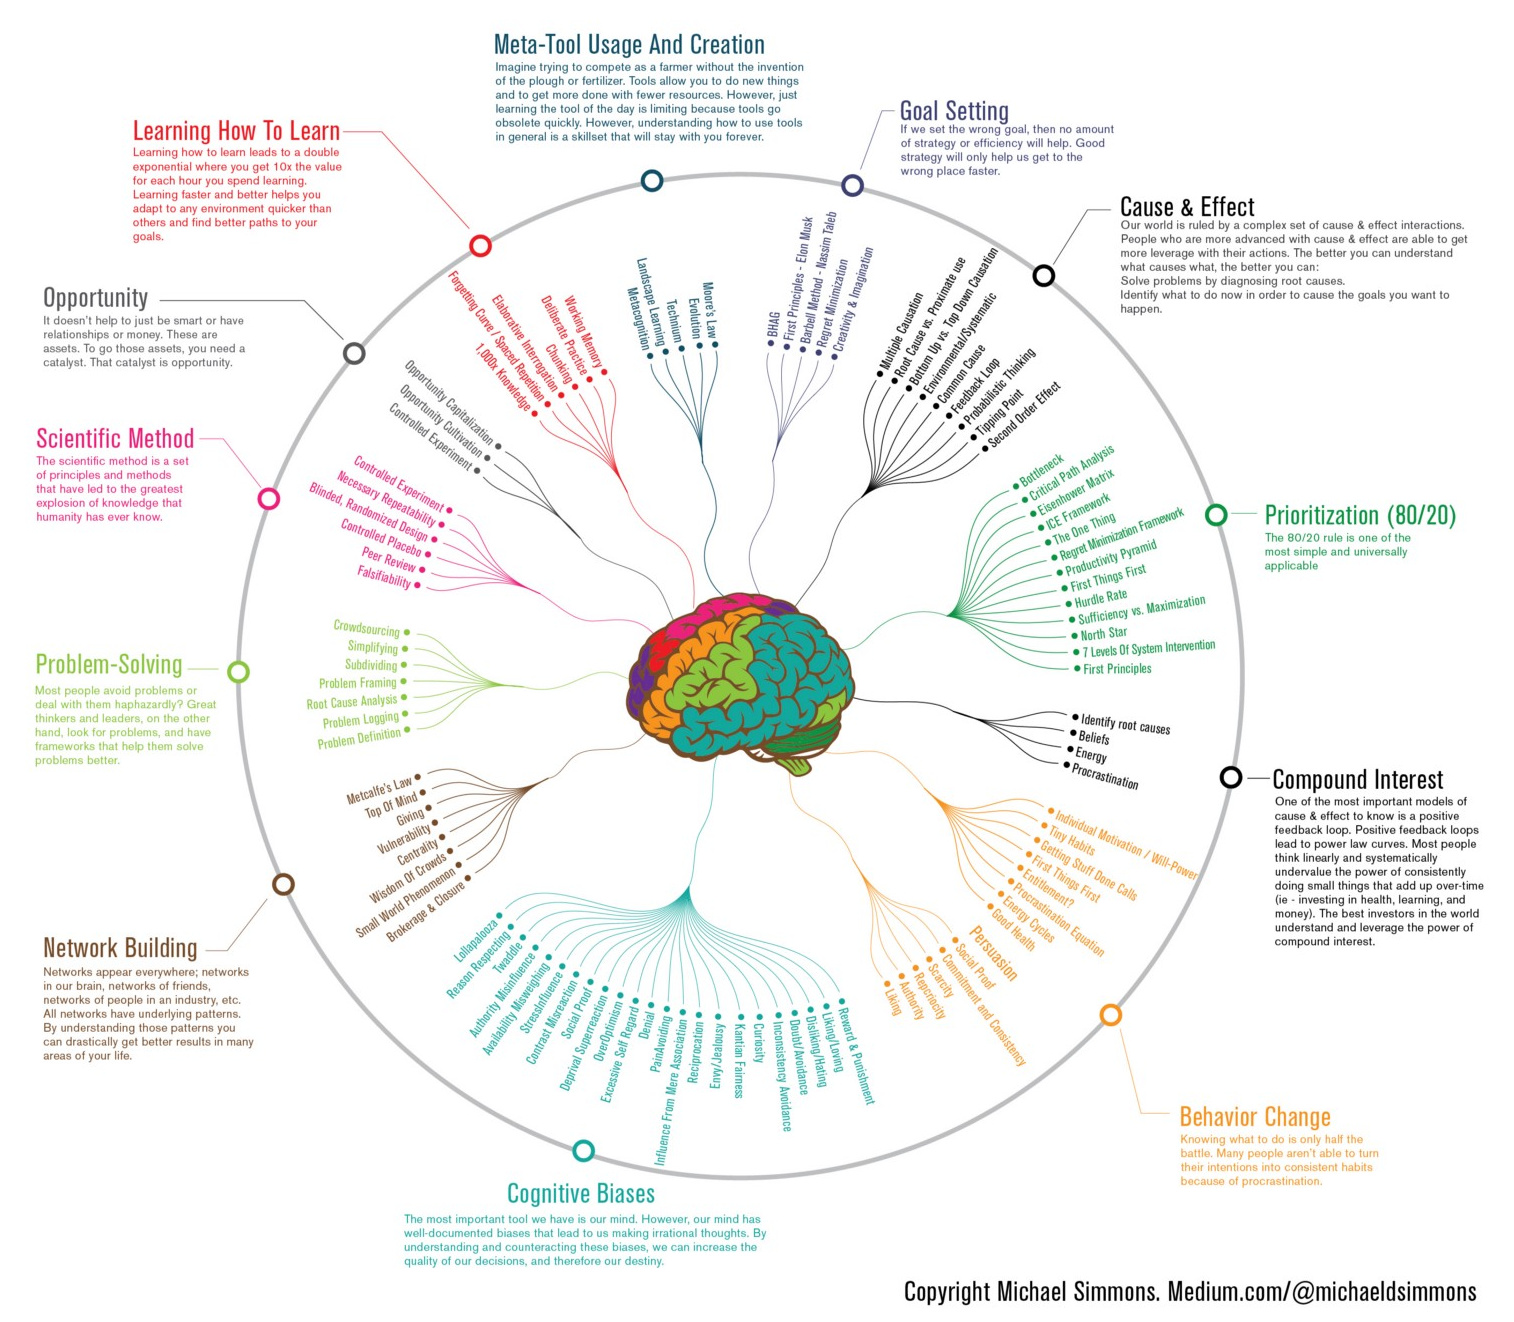
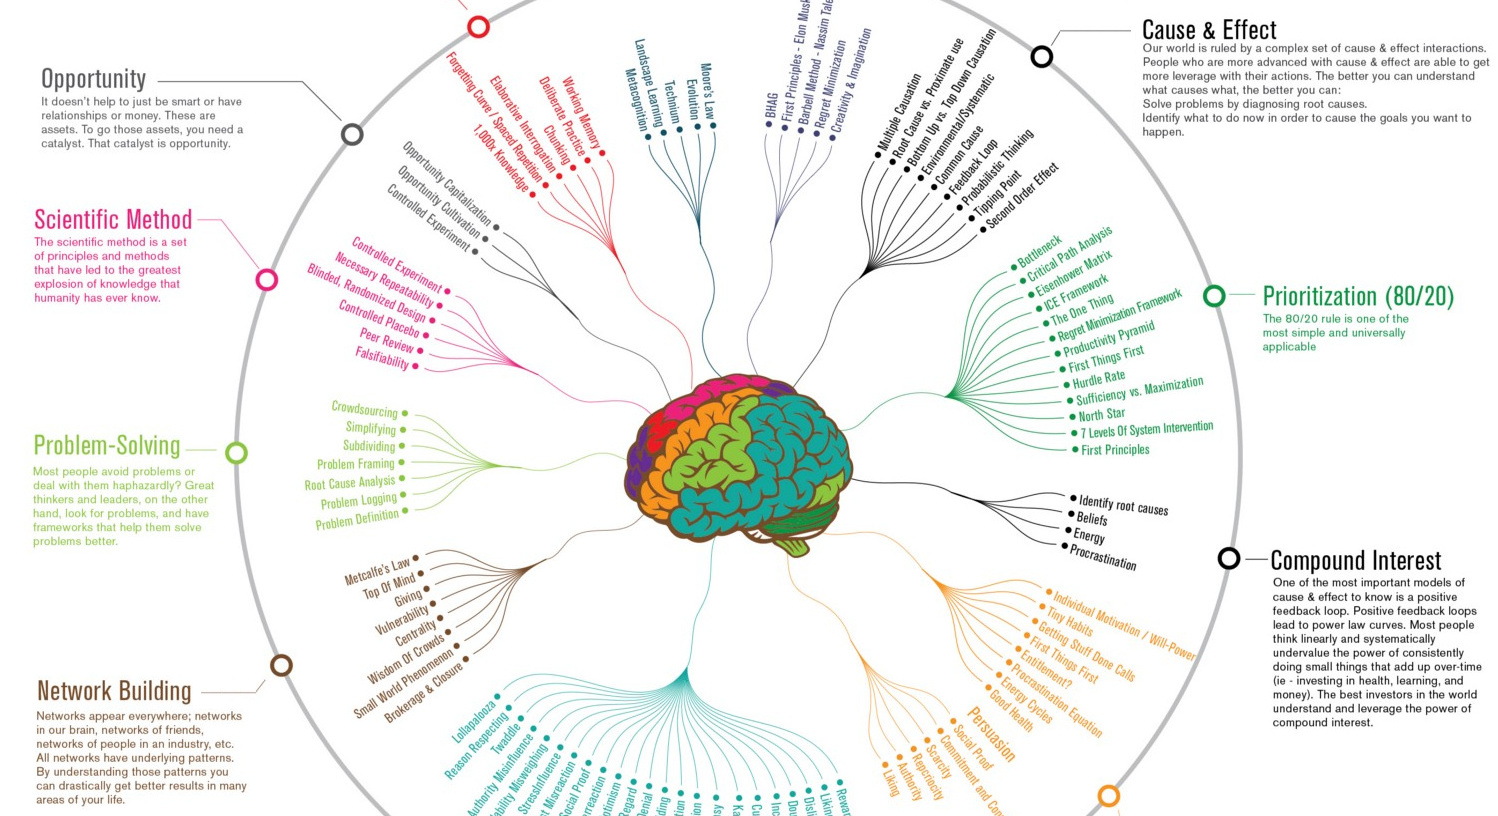
This infographic comes from best-selling author and entrepreneur Michael Simmons, who has collected over 650 mental models through his work. The infographic, in a similar style to one we previously published on cognitive biases, synthesizes these models down to the most useful and universal mental models that people should learn to master first.
Concepts such as the 80/20 rule (Pareto’s principle), compound interest, and network building are summarized in the visualization, and their major components are broken down further within the circle.
Mental Model Examples
Example #1: Pareto’s Principle (80/20 Rule for Prioritization)
In a recent Medium post by Simmons, he highlights a well-known mental model that is the perfect bread crumb to start with.
The 80/20 rule (Pareto’s principle) is named after Italian economist Vilfredo Pareto, who was likely the first person to note the 80/20 connection in an 1896 paper.
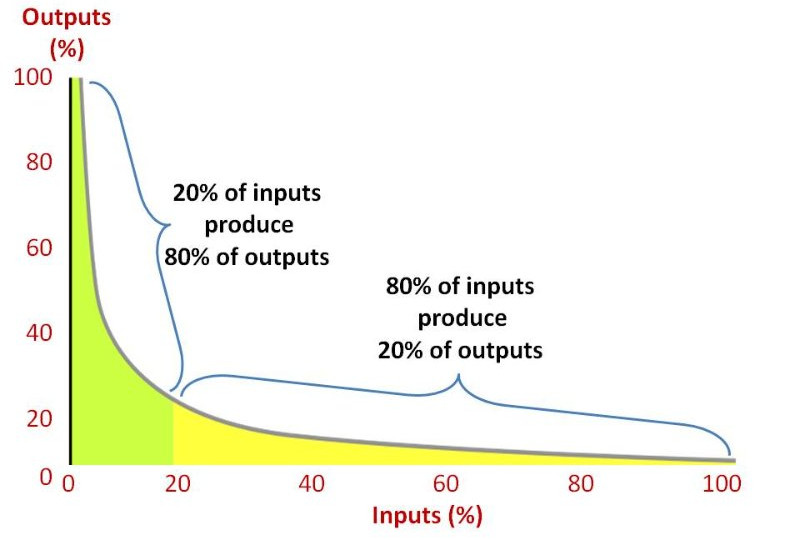
In short, it shows that 20% of inputs (work, time, effort) often leads to 80% of outputs (performance, sales, revenue, etc.), creating an extremely vivid mental framework for making prioritization decisions.
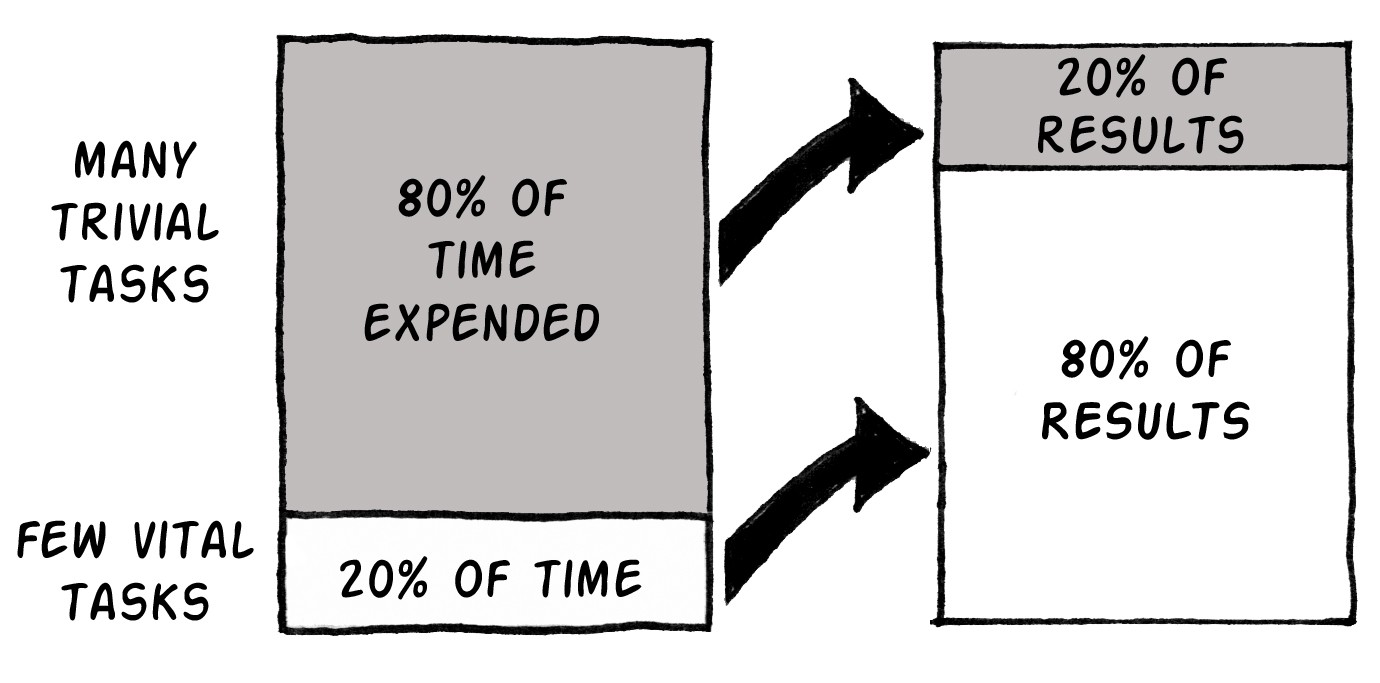
The 80/20 rule represents a power law distribution that has been empirically shown to exist throughout nature, and it also has huge implications on business.
If you focus your effort on these 20% of tasks first, and get the most out of them, you will be able to drive results much more efficiently than wasting time on the 80% “long-tail” shown below.
Example #2: Metcalfe’s Law (Network Building)
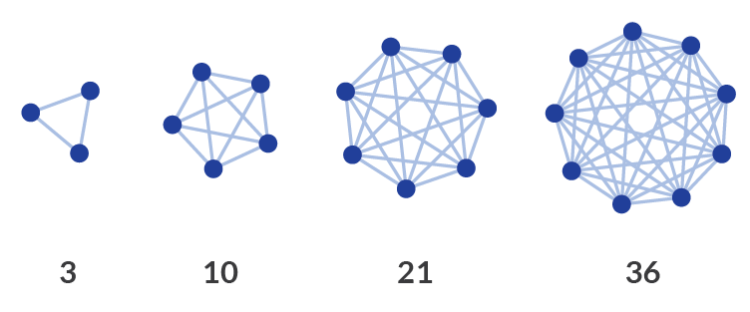
Metcalfe’s Law is one of network effects, stating that a network’s value is proportional to the square of the number of nodes in the network.
From a mental model perspective, this is a useful way to understand how certain types of technology-driven businesses derive value.
If you have a smart grid that is only connected to one power source, that’s alright—but one connected to many different energy sources and potential consumers is much more useful for everyone on the grid. Each additional node provides value for the rest of the connections.
This mental model can be applied outside of strict technology or business terms as well.
For example, if you build a personal network of connections, each additional relationship can provide more value to the other people in your network. It’s the same principle that Harvard or other prestigious universities operate on: the more value a student can get from the alumni network, the higher price they can charge for tuition.
It’s hard to compete with a fully formed network at scale, as they create massive economic moats for the owner. Modern social networks and messaging apps like Facebook, Instagram, LinkedIn, TikTok, WhatsApp, and Snapchat all operate with this in mind.
The Power of Mental Models
These are just two examples of how powerful mental models can be effective in making you think clearer and work smarter.
If you want to be a top performer, it’s worth looking into other mental models out there as well. They can help you better frame reality, so that you can harness your intelligence and effort in the most effective way possible—and it’ll allow you to deliver results along the way.
This post was first published in 2018. We have since updated it, adding in new content for 2021.


Countries
Mapped: The Population of China and India in Perspective
We compare the populations of India and China to other top countries and regions for a unique perspective on the world’s demographics.


The Population of China and India in Perspective
This was originally posted on our Voronoi app. Download the app for free on iOS or Android and discover incredible data-driven charts from a variety of trusted sources.
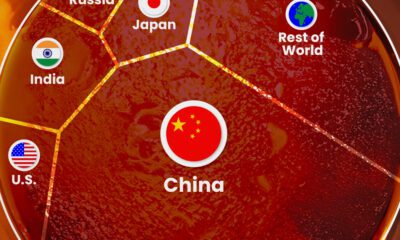
China and India, the world’s two most populous countries, each boast populations exceeding 1.4 billion people.
To put this into perspective, we visualized populations of China and India beside other leading countries and regions. All figures are for 2023, and were accessed via Worldometer.
Data and Key Takeaways
All of the data we used to create this graphic is listed in the table below.
| Country / Region | Population (2023) |
|---|---|
| 🌍 Africa | 1,460,481,772 |
| 🇮🇳 India | 1,428,627,663 |
| 🇨🇳 China | 1,425,671,352 |
| 🌎 Latin America & the Caribbean | 664,997,121 |
| 🇪🇺🇬🇧 EU plus UK | 516,659,018 |
| 🇺🇸 U.S. | 339,996,563 |
| 🇮🇩 Indonesia | 277,534,122 |
From these figures, we can see that the entire population of Africa (currently the fastest growing region in the world) barely surpasses that of China and India.
The populations of China and India are each more than double the size of Latin America and the Caribbean, and nearly triple that of the European Union (including the UK).
Fast Facts on Global Population
Here are some important figures to know regarding the world’s population:
- China accounts for 17.7% of the world’s population, while India represents a slightly larger 17.8% share.
- Africa is the fastest growing region in the world, with annual growth of about 2.4%.
- Europe is the only region in the world that is shrinking, at about -0.17% annually.
Learn More About Demographics from Visual Capitalist
If you enjoy graphics like these, be sure to check out Population Projections: The World’s 6 Largest Countries in 2075.
It reveals a startling contrast between the trajectories of China and India, with the latter peaking at 1.7 billion in the mid-2060s.

-

 Automotive6 days ago
Mapped: Where Tesla and BYD Make Their Cars
-

 Technology2 weeks ago
Charted: How Many Data Centers do Major Big Tech Companies Have?
-

 Globalization2 weeks ago
Charted: Countries Offering Digital Nomad Visas
-

 Politics2 weeks ago
Mapped: Unauthorized Immigrants by State
-

 Technology2 weeks ago
Visualizing the 15 Most Valuable Bitcoin Addresses
-

 Demographics1 week ago
Which Countries Have the Most and Least Women in the Workforce?
-
 Mining1 week ago
Visualizing Raw Steel Production in 2023
-

 Crime1 week ago
Charted: The World’s Highest Homicide Rates, in Each Region