Technology
50 Years of Video Game Industry Revenues, by Platform
Click to view this graphic in a higher-resolution.
50 Years of Video Game Industry Revenues, by Platform
Video killed the radio star.
And the video game industry’s explosive growth over the last five decades has killed any skepticism of its strength and staying power in the larger media and entertainment space.
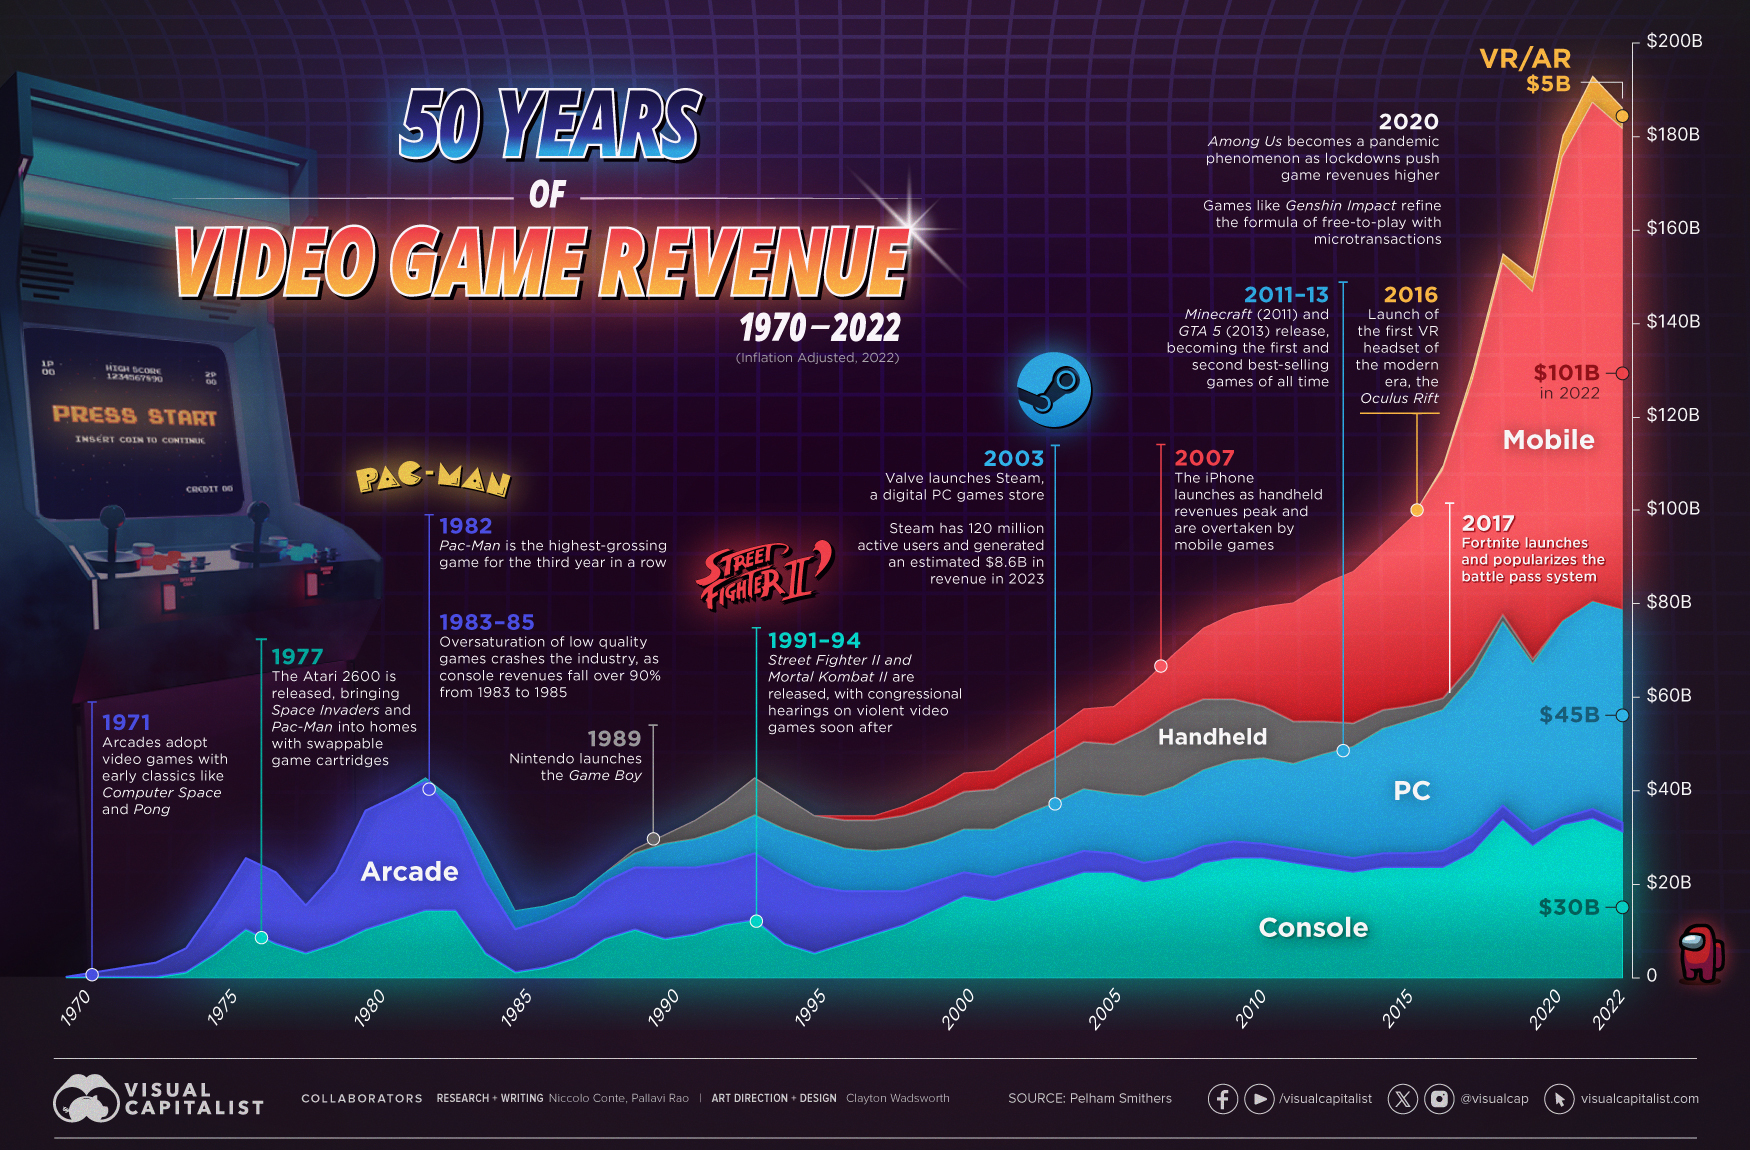
We visualize the video game industry’s inflation-adjusted revenues every year, from its humble beginnings in 1970 to the media juggernaut it is now, worth more than $180 billion of revenue in 2022. All data presented in the chart and in this article was provided by UK-based market intelligence firm Pelham Smithers.
| Year | Total Game Industry Revenue (USD, Billions) | % Increase (YoY) |
|---|---|---|
| 1970 | $0 | N/A |
| 1971 | $1 | N/A |
| 1972 | $2 | 100% |
| 1973 | $3 | 50% |
| 1974 | $6 | 100% |
| 1975 | $15 | 150% |
| 1976 | $25 | 67% |
| 1977 | $22 | -12% |
| 1978 | $15 | -32% |
| 1979 | $22 | 47% |
| 1980 | $35 | 59% |
| 1981 | $38 | 9% |
| 1982 | $42 | 11% |
| 1983 | $37 | -12% |
| 1984 | $26 | -30% |
| 1985 | $14 | -46% |
| 1986 | $15 | 7% |
| 1987 | $17 | 13% |
| 1988 | $22 | 29% |
| 1989 | $27 | 23% |
| 1990 | $30 | 11% |
| 1991 | $33 | 10% |
| 1992 | $37 | 12% |
| 1993 | $42 | 14% |
| 1994 | $38 | -10% |
| 1995 | $34 | -11% |
| 1996 | $34 | 0% |
| 1997 | $34 | 0% |
| 1998 | $36 | 6% |
| 1999 | $39 | 8% |
| 2000 | $43 | 10% |
| 2001 | $44 | 1% |
| 2002 | $48 | 10% |
| 2003 | $52 | 8% |
| 2004 | $57 | 9% |
| 2005 | $57 | 1% |
| 2006 | $62 | 9% |
| 2007 | $68 | 10% |
| 2008 | $74 | 8% |
| 2009 | $77 | 4% |
| 2010 | $78 | 2% |
| 2011 | $79 | 1% |
| 2012 | $83 | 5% |
| 2013 | $85 | 3% |
| 2014 | $91 | 7% |
| 2015 | $97 | 6% |
| 2016 | $108 | 11% |
| 2017 | $128 | 19% |
| 2018 | $152 | 19% |
| 2019 | $147 | -3% |
| 2020 | $177 | 20% |
| 2021 | $190 | 7% |
| 2022 | $183 | -4% |
Note: Numbers are rounded to the nearest billion.
From an industry that was nearly wiped out by a market crash, to the highest-earning media sector today, video games have had a tumultuous journey.
As medium has evolved, so too have the consumer preferences for different gaming platforms. Which formats led the overall industry’s revenue growth through the years?
Arcades, Home Consoles, Handheld Gaming
The history of mass-market consumer-oriented video games starts with Atari.
The company that released Computer Space (1971) and Pong (1972) on coin-operated arcade machines took the market by storm, spawning a series of competitors, earning an estimated $35-40 per day, and selling nearly 8,000 units in two years.
For an industry that barely existed until a couple years prior, those numbers spurred the inception of video games as a legitimate (and profitable) form of entertainment.
| Year | Arcade Revenues (USD, Billions) | Console Revenues (USD, Billions) | Handheld Revenues (USD, Billions) |
|---|---|---|---|
| 1970 | $0 | N/A | N/A |
| 1971 | $1 | N/A | N/A |
| 1972 | $2 | N/A | N/A |
| 1973 | $3 | N/A | N/A |
| 1974 | $5 | $1 | N/A |
| 1975 | $10 | $5 | N/A |
| 1976 | $15 | $10 | N/A |
| 1977 | $15 | $7 | N/A |
| 1978 | $10 | $5 | N/A |
| 1979 | $15 | $7 | N/A |
| 1980 | $25 | $10 | N/A |
| 1981 | $26 | $12 | N/A |
| 1982 | $27 | $14 | N/A |
| 1983 | $20 | $14 | N/A |
| 1984 | $15 | $5 | N/A |
| 1985 | $9 | $1 | N/A |
| 1986 | $10 | $2 | N/A |
| 1987 | $11 | $4 | N/A |
| 1988 | $12 | $8 | N/A |
| 1989 | $13 | $10 | $1 |
| 1990 | $15 | $8 | $2 |
| 1991 | $14 | $9 | $4 |
| 1992 | $13 | $11 | $6 |
| 1993 | $14 | $12 | $8 |
| 1994 | $15 | $7 | $7 |
| 1995 | $14 | $5 | $5 |
| 1996 | $11 | $7 | $6 |
| 1997 | $9 | $9 | $7 |
| 1998 | $7 | $11 | $7 |
| 1999 | $6 | $14 | $8 |
| 2000 | $5 | $17 | $8 |
| 2001 | $5 | $16 | $9 |
| 2002 | $5 | $18 | $9 |
| 2003 | $5 | $20 | $10 |
| 2004 | $5 | $22 | $10 |
| 2005 | $4 | $22 | $11 |
| 2006 | $4 | $20 | $14 |
| 2007 | $4 | $21 | $16 |
| 2008 | $4 | $24 | $15 |
| 2009 | $4 | $25 | $13 |
| 2010 | $3 | $25 | $11 |
| 2011 | $3 | $24 | $9 |
| 2012 | $3 | $23 | $7 |
| 2013 | $3 | $22 | $5 |
| 2014 | $3 | $23 | $4 |
| 2015 | $3 | $23 | $3 |
| 2016 | $4 | $23 | $3 |
| 2017 | $4 | $26 | $3 |
| 2018 | $3 | $33 | $2 |
| 2019 | $3 | $28 | $1 |
| 2020 | $2 | $32 | $0 |
| 2021 | $2 | $33 | $0 |
| 2022 | $2 | $30 | $0 |
| Share of Total Industry Revenue in 2022 | 1.1% | 16.6% | 0.0% |
Note: Numbers are rounded to the nearest billion.
Within just seven years, thanks to the proliferation of arcade games, the video game industry generated more revenue than the American box office and music industry put together.
Then, in the 1980s, a once little-known playing card company in Japan released one of the best-selling video game franchises ever, Super Mario Bros on their home console the Nintendo Entertainment System (NES).
A few years later, at the cusp of the ’90s, Nintendo released the iconic Game Boy on which enthusiasts could play Tetris—a popular arcade game—from the comfort of their bed, cementing video games’ place in consumers’ homes.
PC Gaming, Mobile Gaming, and Virtual Reality
By the ’90s, another technological boom was taking place: the rise of personal computing.
Naturally, companies developed video games (like Doom, Prince of Persia, Dangerous Dave) for this new platform, taking advantage of increased computing power, bigger screens, and more flexibility in programming.
While home consoles still accounted for the majority share of the industry’s revenues, handheld devices and PC gaming split the difference as arcade revenues began to drop rapidly.
| Year | PC Revenues (USD, Billions) | Mobile Revenues (USD, Billions) | VR/AR Revenues (USD, Billions) |
|---|---|---|---|
| 1982 | $1 | N/A | N/A |
| 1983 | $3 | N/A | N/A |
| 1984 | $6 | N/A | N/A |
| 1985 | $4 | N/A | N/A |
| 1986 | $3 | N/A | N/A |
| 1987 | $2 | N/A | N/A |
| 1988 | $2 | N/A | N/A |
| 1989 | $3 | N/A | N/A |
| 1990 | $5 | N/A | N/A |
| 1991 | $6 | N/A | N/A |
| 1992 | $7 | N/A | N/A |
| 1993 | $8 | N/A | N/A |
| 1994 | $9 | N/A | N/A |
| 1995 | $10 | N/A | N/A |
| 1996 | $9 | $1 | N/A |
| 1997 | $9 | $1 | N/A |
| 1998 | $9 | $2 | N/A |
| 1999 | $9 | $3 | N/A |
| 2000 | $9 | $4 | N/A |
| 2001 | $10 | $4 | N/A |
| 2002 | $11 | $5 | N/A |
| 2003 | $12 | $6 | N/A |
| 2004 | $13 | $7 | N/A |
| 2005 | $13 | $8 | N/A |
| 2006 | $14 | $10 | N/A |
| 2007 | $15 | $12 | N/A |
| 2008 | $16 | $15 | N/A |
| 2009 | $17 | $18 | N/A |
| 2010 | $18 | $21 | N/A |
| 2011 | $18 | $25 | N/A |
| 2012 | $21 | $29 | N/A |
| 2013 | $23 | $32 | N/A |
| 2014 | $26 | $35 | N/A |
| 2015 | $28 | $40 | N/A |
| 2016 | $30 | $48 | $1 |
| 2017 | $34 | $60 | $2 |
| 2018 | $39 | $74 | $2 |
| 2019 | $35 | $77 | $3 |
| 2020 | $41 | $98 | $5 |
| 2021 | $44 | $105 | $6 |
| 2022 | $45 | $101 | $5 |
| Share of Total Industry Revenue in 2022 | 24.5% | 55.3% | 2.5% |
Note: Numbers are rounded to the nearest billion.
However, handheld gaming revenues peaked in 2007, the year the iPhone launched, and have steadily declined since then as smartphone adoption has grown.
With smartphones came the mobile gaming juggernaut, which has made up more than half of the gaming industry’s revenues since 2019.
In the last few years however, the development of augmented and virtual reality’s more immersive, and sensory-heavy experiences have created yet another platform for video games, and yet another avenue for growth.
Technology
Charting the Next Generation of Internet
In this graphic, Visual Capitalist has partnered with MSCI to explore the potential of satellite internet as the next generation of internet innovation.
Could Tomorrow’s Internet be Streamed from Space?
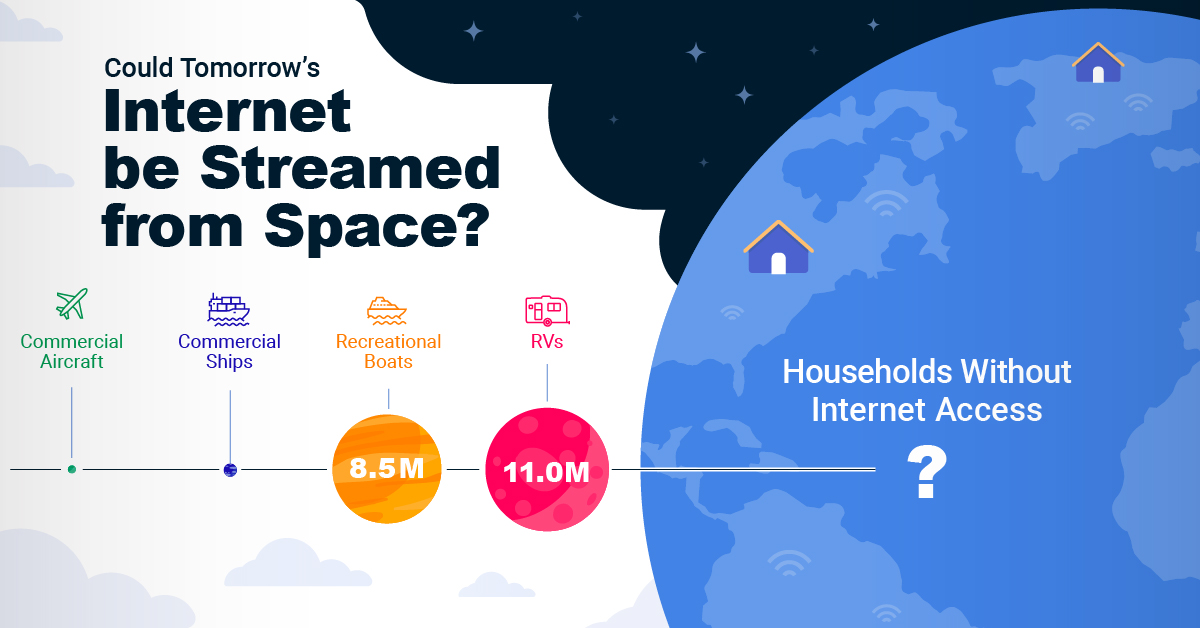
In 2023, 2.6 billion people could not access the internet. Today, companies worldwide are looking to innovative technology to ensure more people are online at the speed of today’s technology.
Could satellite internet provide the solution?
In collaboration with MSCI, we embarked on a journey to explore whether tomorrow’s internet could be streamed from space.
Satellite Internet’s Potential Customer Base
Millions of people live in rural communities or mobile homes, and many spend much of their lives at sea or have no fixed abode. So, they cannot access the internet simply because the technology is unavailable.
Satellite internet gives these communities access to the internet without requiring a fixed location. Consequently, the volume of people who could get online using satellite internet is significant:
| Area | Potential Subscribers |
|---|---|
| Households Without Internet Access | 600,000,000 |
| RVs | 11,000,000 |
| Recreational Boats | 8,500,000 |
| Ships | 100,000 |
| Commercial Aircraft | 25,000 |
Advances in Satellite Technology
Satellite internet is not a new concept. However, it has only recently been that roadblocks around cost and long turnaround times have been overcome.
NASA’s space shuttle, until it was retired in 2011, was the only reusable means of transporting crew and cargo into orbit. It cost over $1.5 billion and took an average of 252 days to launch and refurbish.
In stark contrast, SpaceX’s Falcon 9 can now launch objects into orbit and maintain them at a fraction of the time and cost, less than 1% of the space shuttle’s cost.
| Average Rocket Turnaround Time | Average Launch/Refurbishment Cost | |
|---|---|---|
| Falcon 9* | 21 days | < $1,000,000 |
| Space Shuttle | 252 days | $1,500,000,000 (approximately) |
Satellites are now deployed 300 miles in low Earth orbit (LEO) rather than 22,000 miles above Earth in Geostationary Orbit (GEO), previously the typical satellite deployment altitude.
What this means for the consumer is that satellite internet streamed from LEO has a latency of 40 ms, which is an optimal internet connection. Especially when compared to the 700 ms stream latency experienced with satellite internet streamed from GEO.
What Would it Take to Build a Satellite Internet?
SpaceX, the private company that operates Starlink, currently has 4,500 satellites. However, the company believes it will require 10 times this number to provide comprehensive satellite internet coverage.
Charting the number of active satellites reveals that, despite the increasing number of active satellites, many more must be launched to create a comprehensive satellite internet.
| Year | Number of Active Satellites |
|---|---|
| 2022 | 6,905 |
| 2021 | 4,800 |
| 2020 | 3,256 |
| 2019 | 2,272 |
| 2018 | 2,027 |
| 2017 | 1,778 |
| 2016 | 1,462 |
| 2015 | 1,364 |
| 2014 | 1,262 |
| 2013 | 1,187 |
Next-Generation Internet Innovation
Innovation is at the heart of the internet’s next generation, and the MSCI Next Generation Innovation Index exposes investors to companies that can take advantage of potentially disruptive technologies like satellite internet.
You can gain exposure to companies advancing access to the internet with four indexes:
- MSCI ACWI IMI Next Generation Internet Innovation Index
- MSCI World IMI Next Generation Internet Innovation 30 Index
- MSCI China All Shares IMI Next Generation Internet Innovation Index
- MSCI China A Onshore IMI Next Generation Internet Innovation Index
MSCI thematic indexes are objective, rules-based, and regularly updated to focus on specific emerging trends that could evolve.

Click here to explore the MSCI thematic indexes

-

 Technology1 week ago
Countries With the Highest Rates of Crypto Ownership
While the U.S. is a major market for cryptocurrencies, two countries surpass it in terms of their rates of crypto ownership.
-

 Technology2 weeks ago
Mapped: The Number of AI Startups By Country
Over the past decade, thousands of AI startups have been funded worldwide. See which countries are leading the charge in this map graphic.
-

 Technology3 weeks ago
All of the Grants Given by the U.S. CHIPS Act
Intel, TSMC, and more have received billions in subsidies from the U.S. CHIPS Act in 2024.
-

 Technology3 weeks ago
Visualizing AI Patents by Country
See which countries have been granted the most AI patents each year, from 2012 to 2022.
-

 Technology4 weeks ago
How Tech Logos Have Evolved Over Time
From complete overhauls to more subtle tweaks, these tech logos have had quite a journey. Featuring: Google, Apple, and more.
-

 AI1 month ago
Ranked: Semiconductor Companies by Industry Revenue Share
Nvidia is coming for Intel’s crown. Samsung is losing ground. AI is transforming the space. We break down revenue for semiconductor companies.
-

 Personal Finance1 week ago
Visualizing the Tax Burden of Every U.S. State
-

 Misc6 days ago
Visualized: Aircraft Carriers by Country
-

 Culture6 days ago
How Popular Snack Brand Logos Have Changed
-

 Mining1 week ago
Visualizing Copper Production by Country in 2023
-

 Misc1 week ago
Charted: How Americans Feel About Federal Government Agencies
-

 Healthcare1 week ago
Which Countries Have the Highest Infant Mortality Rates?
-

 Demographics1 week ago
Mapped: U.S. Immigrants by Region
-

 Maps1 week ago
Mapped: Southeast Asia’s GDP Per Capita, by Country

